Glance 接受模型對象並返回 tibble::tibble(),其中僅包含一行模型摘要。摘要通常是擬合優度度量、殘差假設檢驗的 p 值或模型收斂信息。
Glance 永遠不會返返回自對建模函數的原始調用的信息。這包括建模函數的名稱或傳遞給建模函數的任何參數。
Glance 不計算匯總度量。相反,它將這些計算外包給適當的方法並將結果收集在一起。有時擬合優度測量是不確定的。在這些情況下,該度量將報告為 NA 。
無論模型矩陣是否秩虧,Glance 都會返回相同的列數。如果是這樣,則不再具有明確定義值的列中的條目將使用適當類型的 NA 進行填充。
參數
- x
-
從
survival::survreg()返回的survreg對象。 - ...
-
附加參數。不曾用過。僅需要匹配通用簽名。注意:拚寫錯誤的參數將被吸收到
...中,並被忽略。如果拚寫錯誤的參數有默認值,則將使用默認值。例如,如果您傳遞conf.lvel = 0.9,所有計算將使用conf.level = 0.95進行。這裏有兩個異常:
也可以看看
glance() , survival::survreg()
其他 survreg 整理器:augment.survreg() 、tidy.survreg()
其他生存整理器:augment.coxph() , augment.survreg() , glance.aareg() , glance.cch() , glance.coxph() , glance.pyears() , glance.survdiff() , glance.survexp() , glance.survfit() , tidy.aareg() , tidy.cch() , tidy.coxph() , tidy.pyears() , tidy.survdiff() , tidy.survexp() , tidy.survfit() , tidy.survreg()
值
恰好隻有一行和一列的 tibble::tibble():
- AIC
-
模型的 Akaike 信息準則。
- BIC
-
模型的貝葉斯信息準則。
- df
-
模型使用的自由度。
- df.residual
-
剩餘自由度。
- iter
-
算法/擬合過程的迭代已完成。
- logLik
-
模型的對數似然。 [stats::logLik()] 可能是一個有用的參考。
- nobs
-
使用的觀察數。
- p.value
-
對應於檢驗統計量的 P 值。
- statistic
-
卡方統計量。
例子
# load libraries for models and data
library(survival)

# fit model
sr <- survreg(
  Surv(futime, fustat) ~ ecog.ps + rx,
  ovarian,
  dist = "exponential"
)

# summarize model fit with tidiers + visualization
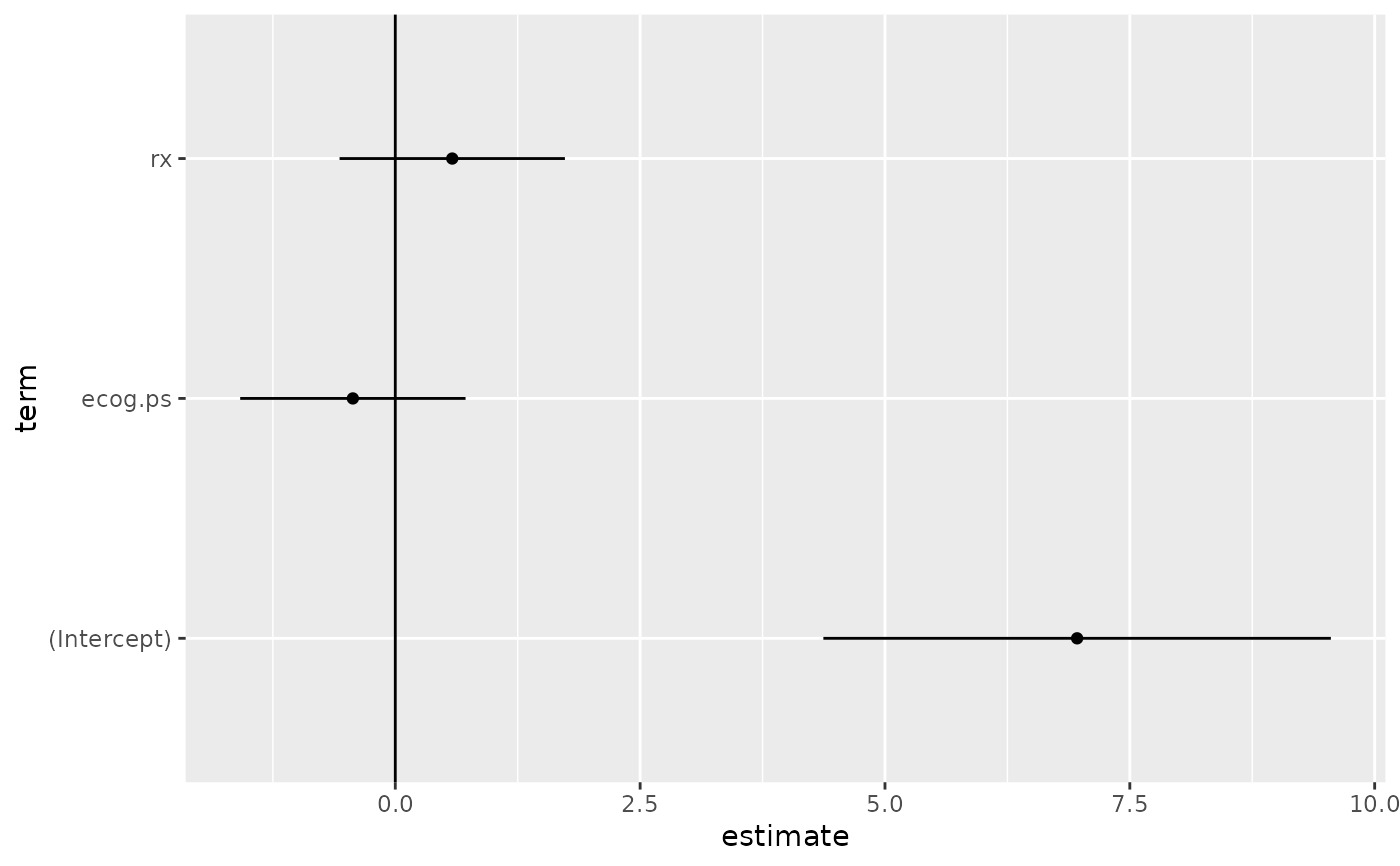
tidy(sr)
#> # A tibble: 3 × 5
#>   term        estimate std.error statistic     p.value
#>   <chr>          <dbl>     <dbl>     <dbl>       <dbl>
#> 1 (Intercept)    6.96      1.32      5.27  0.000000139
#> 2 ecog.ps       -0.433     0.587    -0.738 0.461
#> 3 rx             0.582     0.587     0.991 0.322
augment(sr, ovarian)
#> # A tibble: 26 × 9
#>    futime fustat   age resid.ds    rx ecog.ps .fitted .se.fit .resid
#>     <dbl>  <dbl> <dbl>    <dbl> <dbl>   <dbl>   <dbl>   <dbl>  <dbl>
#>  1     59      1  72.3        2     1       1   1224.    639. -1165.
#>  2    115      1  74.5        2     1       1   1224.    639. -1109.
#>  3    156      1  66.5        2     1       2    794.    350.  -638.
#>  4    421      0  53.4        2     2       1   2190.   1202. -1769.
#>  5    431      1  50.3        2     1       1   1224.    639.  -793.
#>  6    448      0  56.4        1     1       2    794.    350.  -346.
#>  7    464      1  56.9        2     2       2   1420.    741.  -956.
#>  8    475      1  59.9        2     2       2   1420.    741.  -945.
#>  9    477      0  64.2        2     1       1   1224.    639.  -747.
#> 10    563      1  55.2        1     2       2   1420.    741.  -857.
#> # ℹ 16 more rows
glance(sr)
#> # A tibble: 1 × 9
#>    iter    df statistic logLik   AIC   BIC df.residual  nobs p.value
#>   <int> <int>     <dbl>  <dbl> <dbl> <dbl>       <int> <int>   <dbl>
#> 1     4     3      1.67  -97.2  200.  204.          23    26   0.434

# coefficient plot
td <- tidy(sr, conf.int = TRUE)

library(ggplot2)

ggplot(td, aes(estimate, term)) +
  geom_point() +
  geom_errorbarh(aes(xmin = conf.low, xmax = conf.high), height = 0) +
  geom_vline(xintercept = 0)

相關用法
- R broom glance.survexp 瀏覽 a(n) survexp 對象
- R broom glance.survdiff 瀏覽 a(n) survdiff 對象
- R broom glance.survfit 瀏覽 a(n) survfit 對象
- R broom glance.summary.lm 瀏覽一個(n)summary.lm對象
- R broom glance.sarlm 瀏覽一個(n)spatialreg對象
- R broom glance.svyglm 瀏覽 svyglm 對象
- R broom glance.speedglm 看一眼 speedglm 對象
- R broom glance.speedlm 掃視一個 speedlm 對象
- R broom glance.svyolr 瞥一眼 svyolr 對象
- R broom glance.smooth.spline 整理一個 smooth.spine 對象
- R broom glance.rlm 瀏覽 a(n) rlm 對象
- R broom glance.felm 瞥一眼毛氈物體
- R broom glance.geeglm 瀏覽 a(n) geeglm 對象
- R broom glance.plm 瀏覽一個 (n) plm 對象
- R broom glance.biglm 瀏覽 a(n) biglm 對象
- R broom glance.clm 瀏覽 a(n) clm 對象
- R broom glance.rma 瀏覽一個(n) rma 對象
- R broom glance.multinom 瀏覽一個(n)多項對象
- R broom glance.rq 查看 a(n) rq 對象
- R broom glance.mjoint 查看 a(n) mjoint 對象
- R broom glance.fitdistr 瀏覽 a(n) fitdistr 對象
- R broom glance.glm 瀏覽 a(n) glm 對象
- R broom glance.coxph 瀏覽 a(n) coxph 對象
- R broom glance.margins 瀏覽 (n) 個 margins 對象
- R broom glance.poLCA 瀏覽一個(n) poLCA 對象
注:本文由純淨天空篩選整理自等大神的英文原創作品 Glance at a(n) survreg object。非經特殊聲明,原始代碼版權歸原作者所有,本譯文未經允許或授權,請勿轉載或複製。
