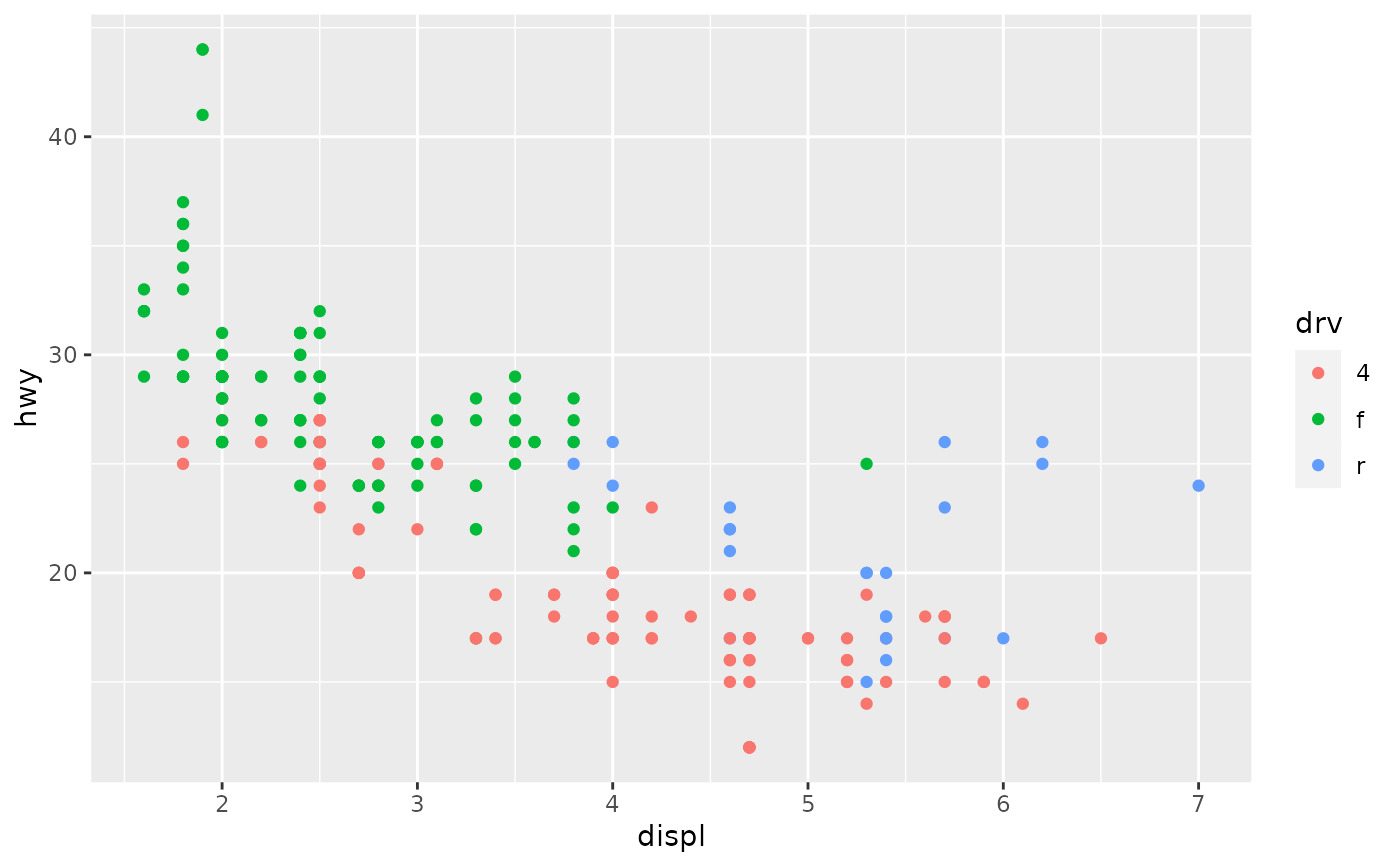
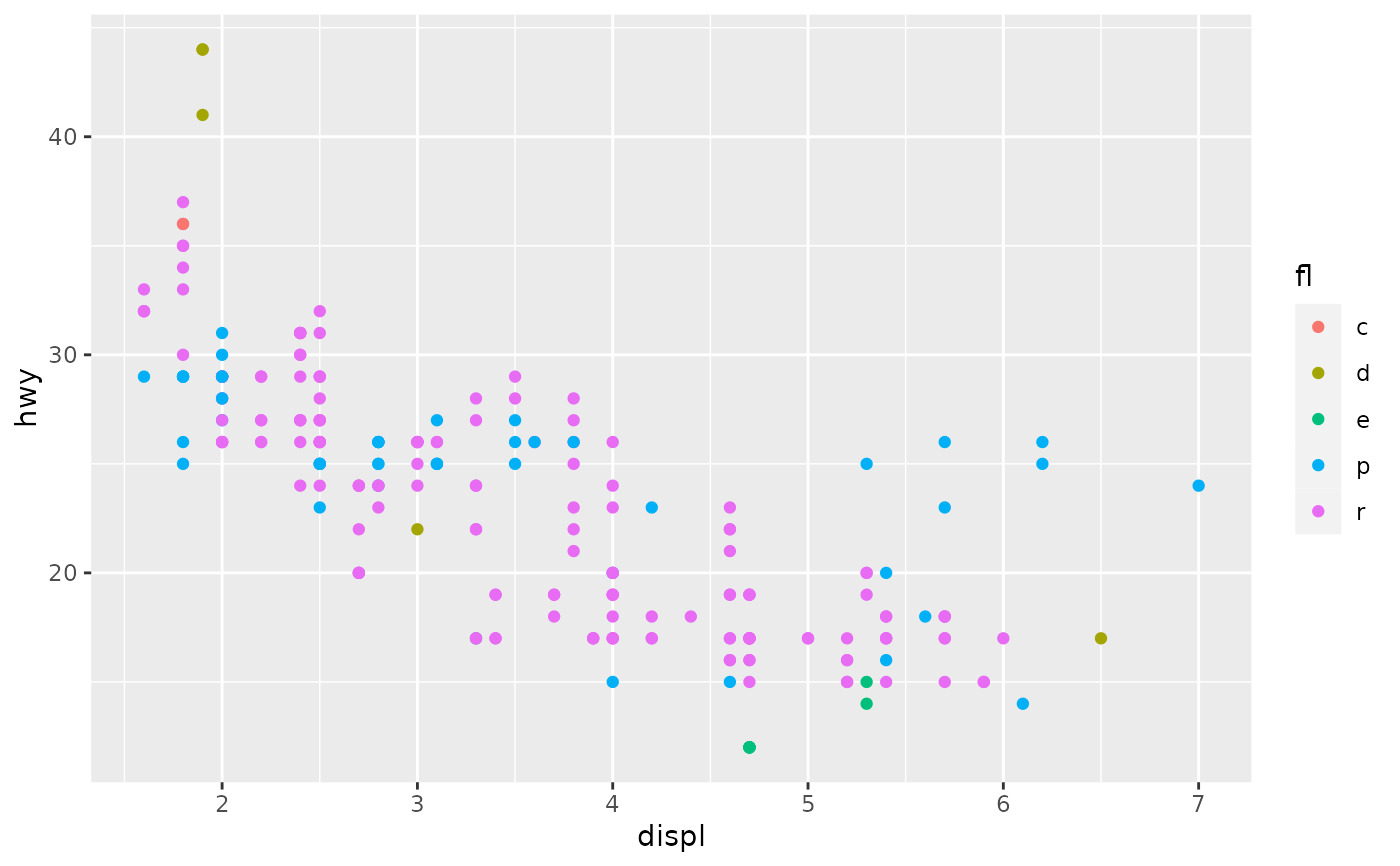
通常,您不需要显式打印或绘制 ggplot2 图:默认的顶级打印方法将为您完成此操作。但是,如果您想在函数或 for 循环内绘制绘图,则需要显式调用 print()。
用法
# S3 method for ggplot
print(x, newpage = is.null(vp), vp = NULL, ...)

# S3 method for ggplot
plot(x, newpage = is.null(vp), vp = NULL, ...)例子
colours <- list(~class, ~drv, ~fl)

# Doesn't seem to do anything!
for (colour in colours) {
  ggplot(mpg, aes_(~ displ, ~ hwy, colour = colour)) +
    geom_point()
}
#> Warning: `aes_()` was deprecated in ggplot2 3.0.0.
#> ℹ Please use tidy evaluation idioms with `aes()`

# Works when we explicitly print the plots
for (colour in colours) {
  print(ggplot(mpg, aes_(~ displ, ~ hwy, colour = colour)) +
    geom_point())
}


相关用法
- R ggplot2 print.ggproto 格式化或打印 ggproto 对象
- R ggplot2 position_stack 将重叠的对象堆叠在一起
- R ggplot2 position_dodge 躲避左右重叠的物体
- R ggplot2 position_nudge 将点微移固定距离
- R ggplot2 position_jitter 抖动点以避免过度绘制
- R ggplot2 position_jitterdodge 同时闪避和抖动
- R ggplot2 annotation_logticks 注释:记录刻度线
- R ggplot2 vars 引用分面变量
- R ggplot2 geom_qq 分位数-分位数图
- R ggplot2 geom_spoke 由位置、方向和距离参数化的线段
- R ggplot2 geom_quantile 分位数回归
- R ggplot2 geom_text 文本
- R ggplot2 get_alt_text 从绘图中提取替代文本
- R ggplot2 annotation_custom 注释:自定义grob
- R ggplot2 geom_ribbon 函数区和面积图
- R ggplot2 stat_ellipse 计算法行数据椭圆
- R ggplot2 resolution 计算数值向量的“分辨率”
- R ggplot2 geom_boxplot 盒须图(Tukey 风格)
- R ggplot2 lims 设置规模限制
- R ggplot2 geom_hex 二维箱计数的六边形热图
- R ggplot2 scale_gradient 渐变色阶
- R ggplot2 scale_shape 形状比例,又称字形
- R ggplot2 geom_bar 条形图
- R ggplot2 draw_key 图例的关键字形
- R ggplot2 annotate 创建注释层
注:本文由纯净天空筛选整理自Hadley Wickham等大神的英文原创作品 Explicitly draw plot。非经特殊声明,原始代码版权归原作者所有,本译文未经允许或授权,请勿转载或复制。
