颜色条指南显示映射到值的连续色标。颜色条可用于 scale_fill 和 scale_colour 。有关更多信息,请参阅此函数的灵感:Matlab's colorbar function。
用法
guide_colourbar(
  title = waiver(),
  title.position = NULL,
  title.theme = NULL,
  title.hjust = NULL,
  title.vjust = NULL,
  label = TRUE,
  label.position = NULL,
  label.theme = NULL,
  label.hjust = NULL,
  label.vjust = NULL,
  barwidth = NULL,
  barheight = NULL,
  nbin = 300,
  raster = TRUE,
  frame.colour = NULL,
  frame.linewidth = 0.5/.pt,
  frame.linetype = 1,
  ticks = TRUE,
  ticks.colour = "white",
  ticks.linewidth = 0.5/.pt,
  draw.ulim = TRUE,
  draw.llim = TRUE,
  direction = NULL,
  default.unit = "line",
  reverse = FALSE,
  order = 0,
  available_aes = c("colour", "color", "fill"),
  ...
)

guide_colorbar(
  title = waiver(),
  title.position = NULL,
  title.theme = NULL,
  title.hjust = NULL,
  title.vjust = NULL,
  label = TRUE,
  label.position = NULL,
  label.theme = NULL,
  label.hjust = NULL,
  label.vjust = NULL,
  barwidth = NULL,
  barheight = NULL,
  nbin = 300,
  raster = TRUE,
  frame.colour = NULL,
  frame.linewidth = 0.5/.pt,
  frame.linetype = 1,
  ticks = TRUE,
  ticks.colour = "white",
  ticks.linewidth = 0.5/.pt,
  draw.ulim = TRUE,
  draw.llim = TRUE,
  direction = NULL,
  default.unit = "line",
  reverse = FALSE,
  order = 0,
  available_aes = c("colour", "color", "fill"),
  ...
)
参数
- title
-
指示指南标题的字符串或表达式。如果是
NULL,则不显示标题。默认情况下 (waiver()),比例对象的名称或labs()中指定的名称用作标题。 - title.position
-
表示标题位置的字符串。 "top"(垂直参考线默认)、"bottom"、"left"(水平参考线默认)或 "right." 之一
- title.theme
-
用于渲染标题文本的主题对象。通常需要
element_text()对象。默认情况下,主题由theme()或主题中的legend.title指定。 - title.hjust
-
指定标题文本的水平对齐方式的数字。
- title.vjust
-
指定标题文本垂直对齐的数字。
- label
-
合乎逻辑的。如果
TRUE则绘制标签。如果FALSE则标签不可见。 - label.position
-
指示标签位置的字符串。 "top"、"bottom"(水平参考线默认)、"left" 或 "right"(垂直参考线默认)之一。
- label.theme
-
用于渲染标签文本的主题对象。通常需要
element_text()对象。默认情况下,主题由theme()中的legend.text指定。 - label.hjust
-
指定标签文本水平对齐的数字。对于表达式,标准文本的默认值是 0(左对齐)和 1(右对齐)。
- label.vjust
-
指定标签文本垂直对齐的数字。
- barwidth
-
指定颜色条宽度的数字或
grid::unit()对象。默认值为theme()或主题中的legend.key.width或legend.key.size。 - barheight
-
指定颜色条高度的数字或
grid::unit()对象。默认值为theme()或主题中的legend.key.height或legend.key.size。 - nbin
-
一个数字,指定用于绘制颜色条的容器数。值越大,颜色条越平滑。
- raster
-
一个合乎逻辑的。如果
TRUE,则颜色条将呈现为光栅对象。如果FALSE,则颜色条将呈现为一组矩形。请注意,并非所有图形设备都能够渲染光栅图像。 - frame.colour
-
指定围绕条绘制的框架颜色的字符串。如果
NULL(默认值),则不绘制框架。 - frame.linewidth
-
一个数字,指定围绕条绘制的框架的宽度(以毫米为单位)。
- frame.linetype
-
一个数字,指定围绕条绘制的框架的线型。
- ticks
-
指定颜色条上的刻度线是否可见的逻辑。
- ticks.colour
-
指定刻度线颜色的字符串。
- ticks.linewidth
-
指定刻度线宽度的数字(以毫米为单位)。
- draw.ulim
-
指定上限刻度线是否可见的逻辑。
- draw.llim
-
指定下限刻度线是否可见的逻辑。
- direction
-
指示引导方向的字符串。 "horizontal" 或 "vertical." 之一
- default.unit
-
对于
barwidth和barheight表示grid::unit()的字符串。 - reverse
-
合乎逻辑的。如果
TRUE则颜色条反转。默认情况下,最高值位于顶部,最低值位于底部 - order
-
小于 99 的正整数,指定该指南在多个指南中的顺序。这控制多个指南的显示顺序,而不是指南本身的内容。如果为 0(默认),则顺序由秘密算法确定。
- available_aes
-
列出可以绘制颜色条的美学的字符串向量。
- ...
-
被忽略。
细节
可以在每个 scale_* 或 guides() 中指定指南。 scale_* 中的 guide="legend" 是 guide=guide_legend() 的语法糖(例如 scale_colour_manual(guide = "legend") )。至于如何更详细地指定每个尺度的指南,请参见guides()。
也可以看看
其他指南:guide_bins()、guide_coloursteps()、guide_legend()、guides()
例子
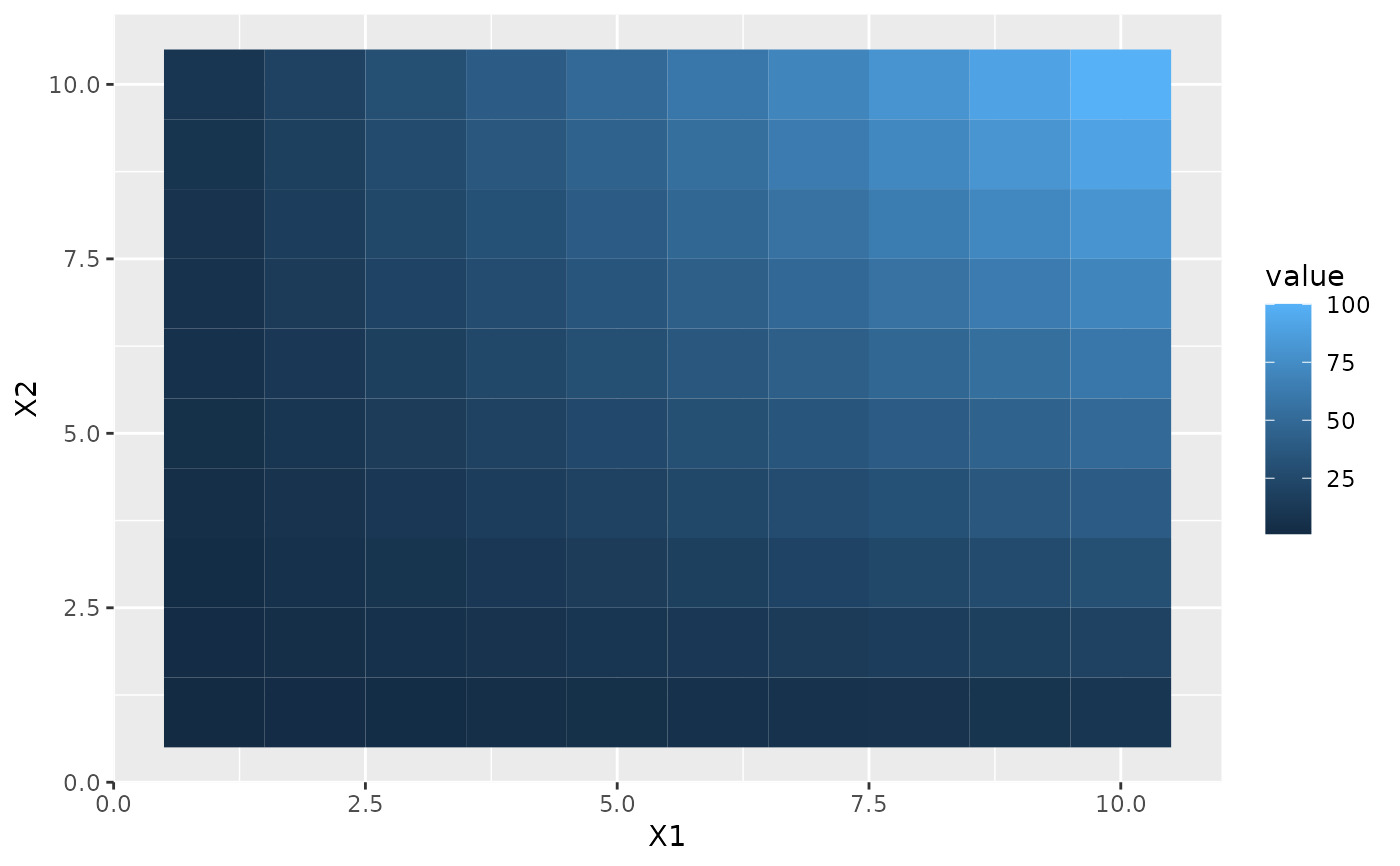
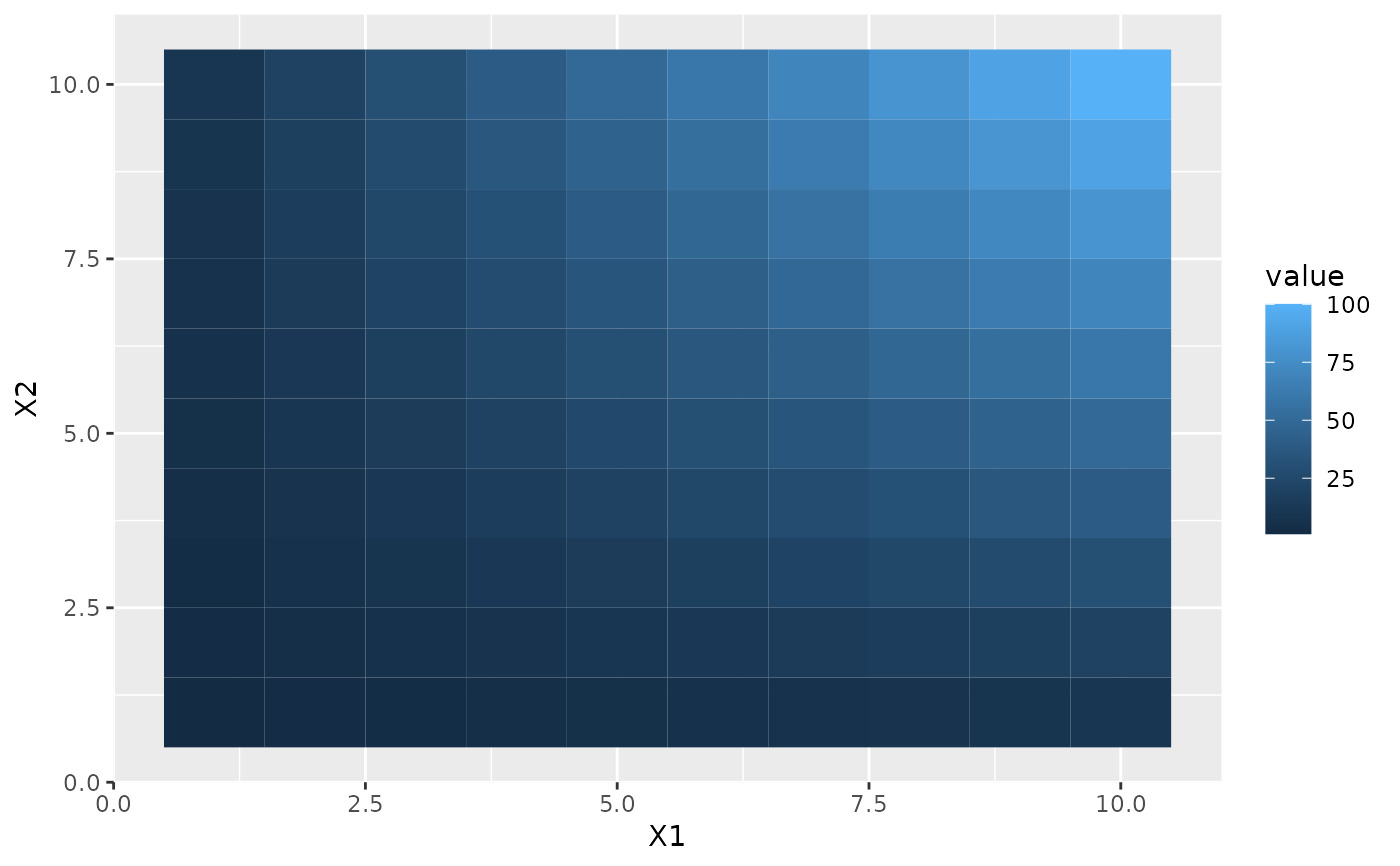
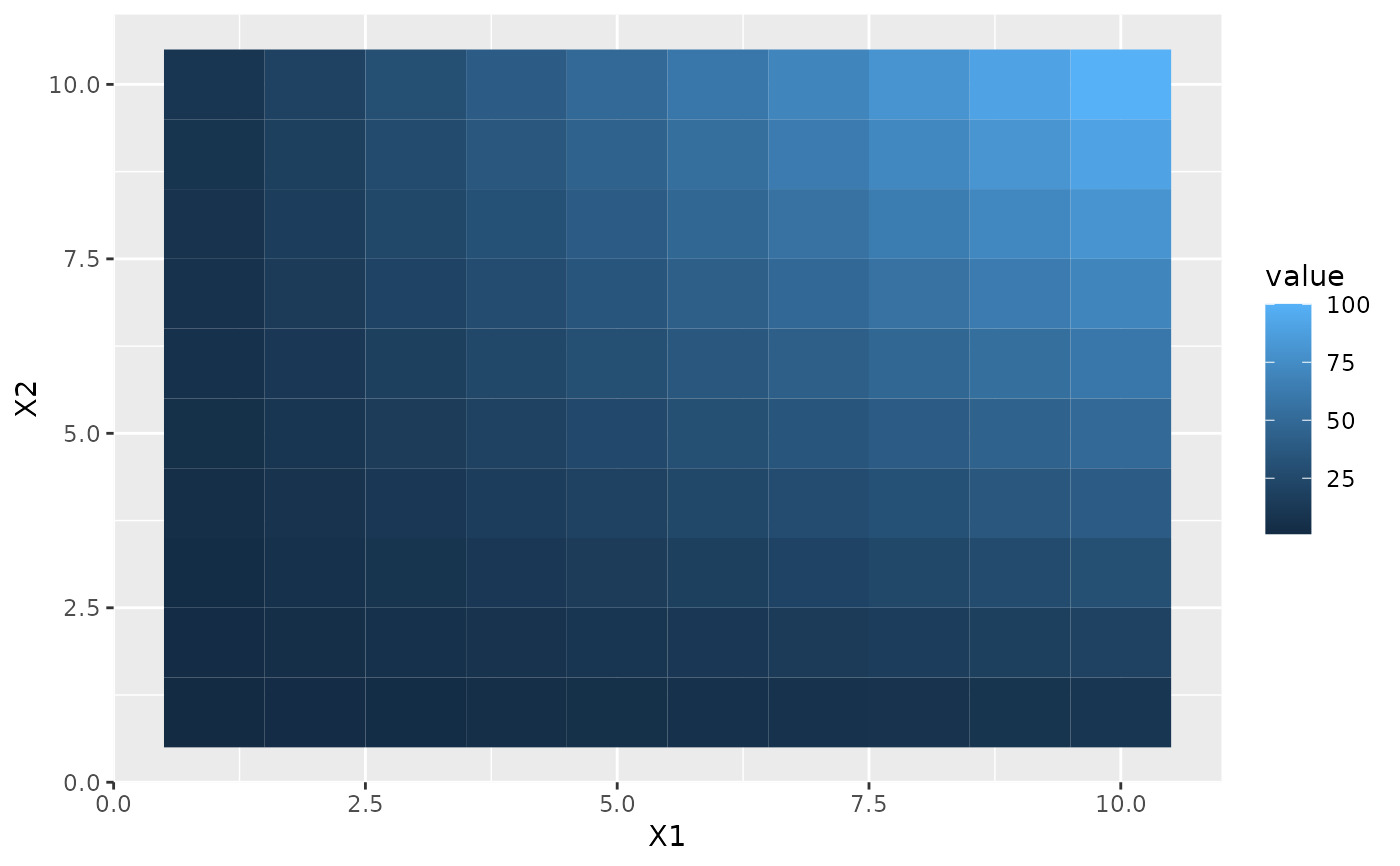
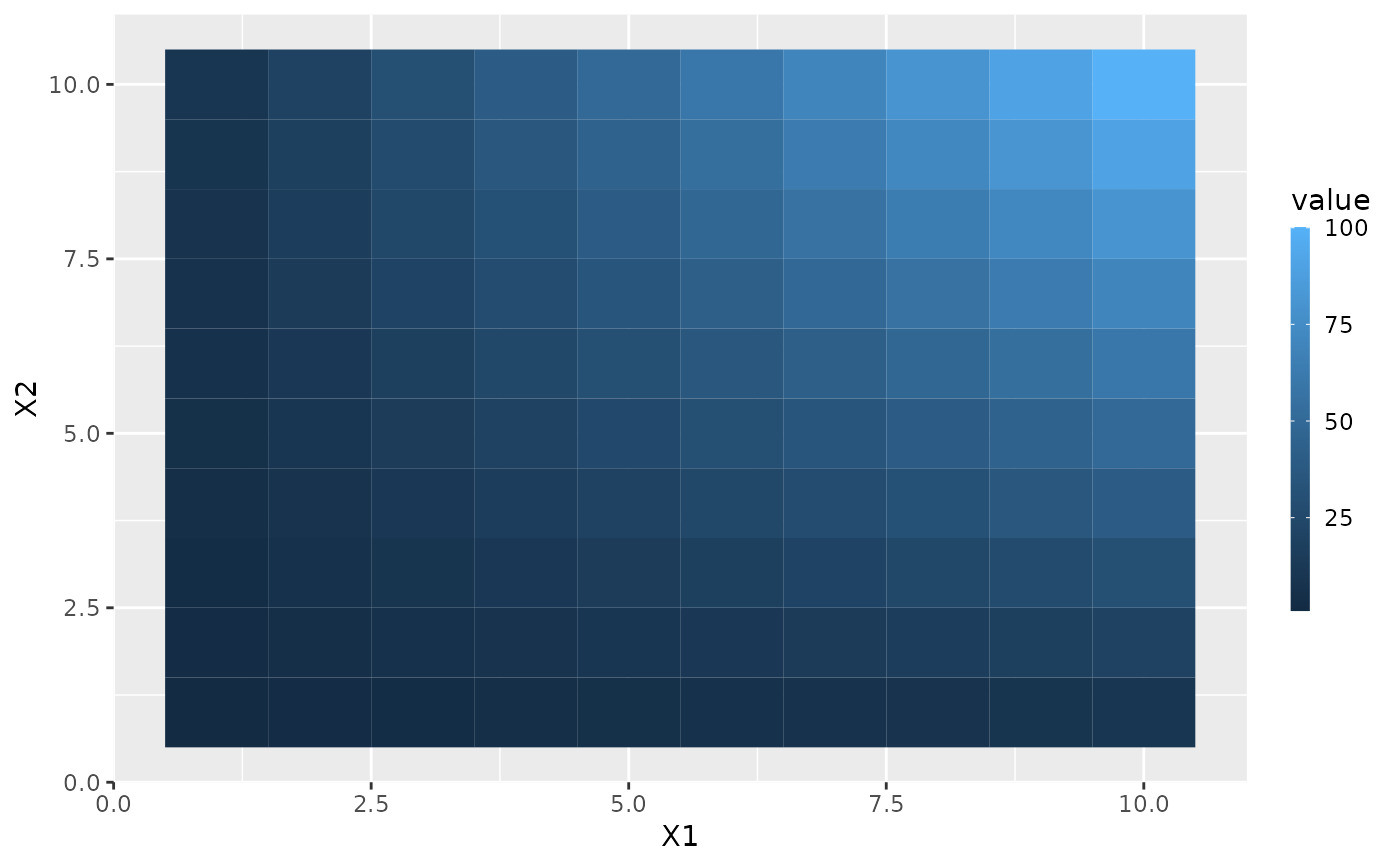
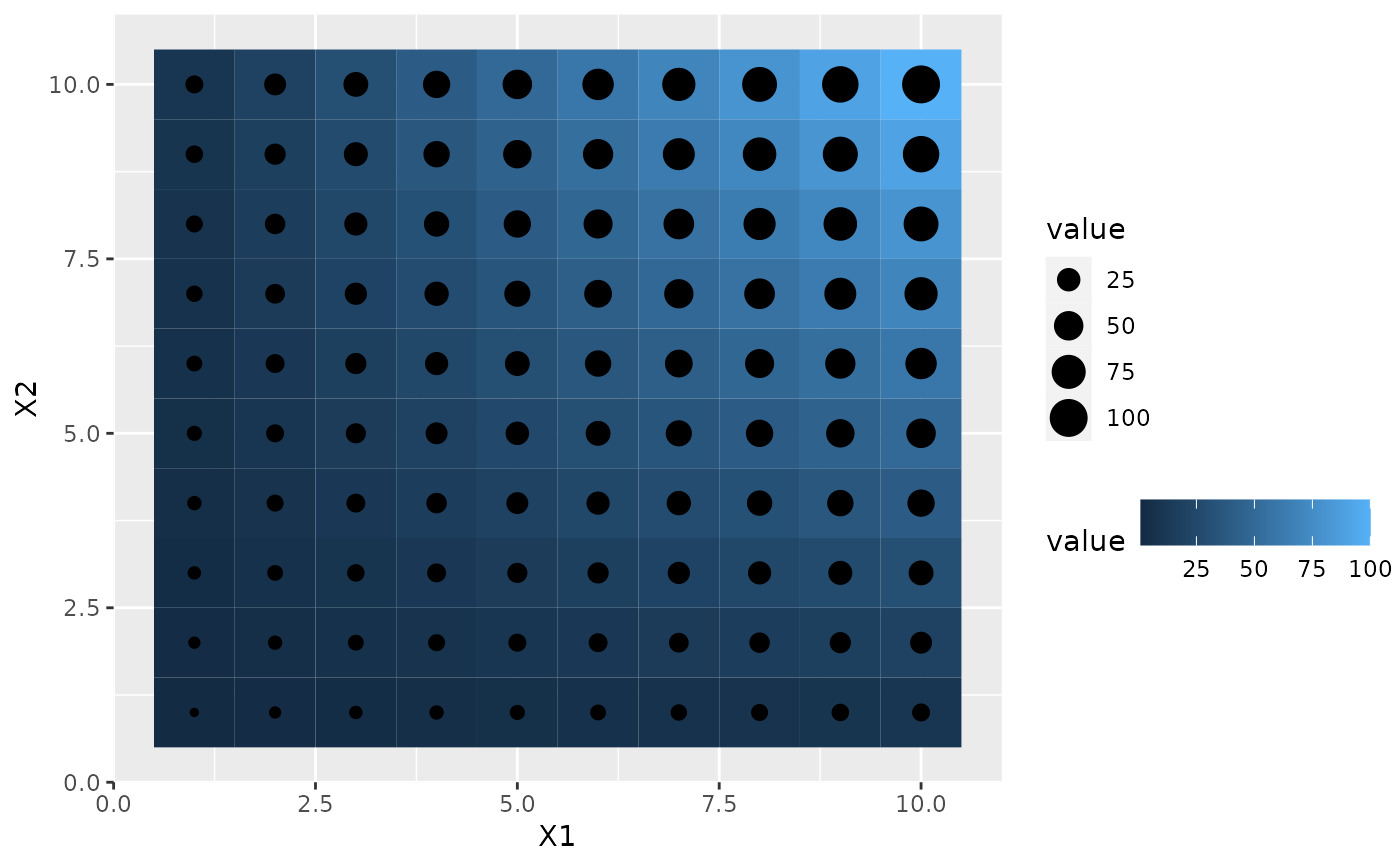
df <- expand.grid(X1 = 1:10, X2 = 1:10)
df$value <- df$X1 * df$X2
p1 <- ggplot(df, aes(X1, X2)) + geom_tile(aes(fill = value))
p2 <- p1 + geom_point(aes(size = value))
# Basic form
p1 + scale_fill_continuous(guide = "colourbar")
 p1 + scale_fill_continuous(guide = guide_colourbar())
 p1 + guides(fill = guide_colourbar())
 # Control styles
# bar size
p1 + guides(fill = guide_colourbar(barwidth = 0.5, barheight = 10))
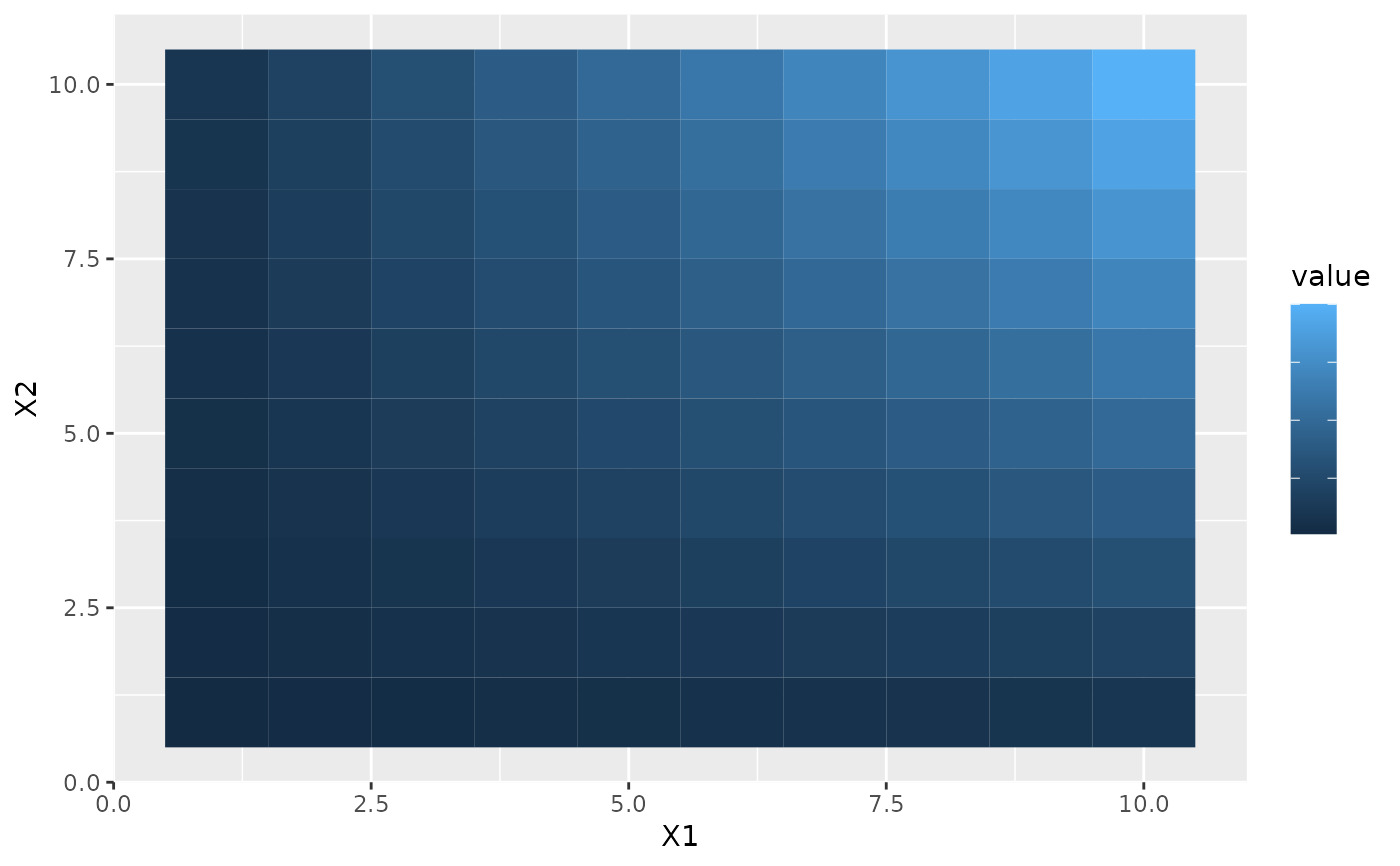
 # no label
p1 + guides(fill = guide_colourbar(label = FALSE))
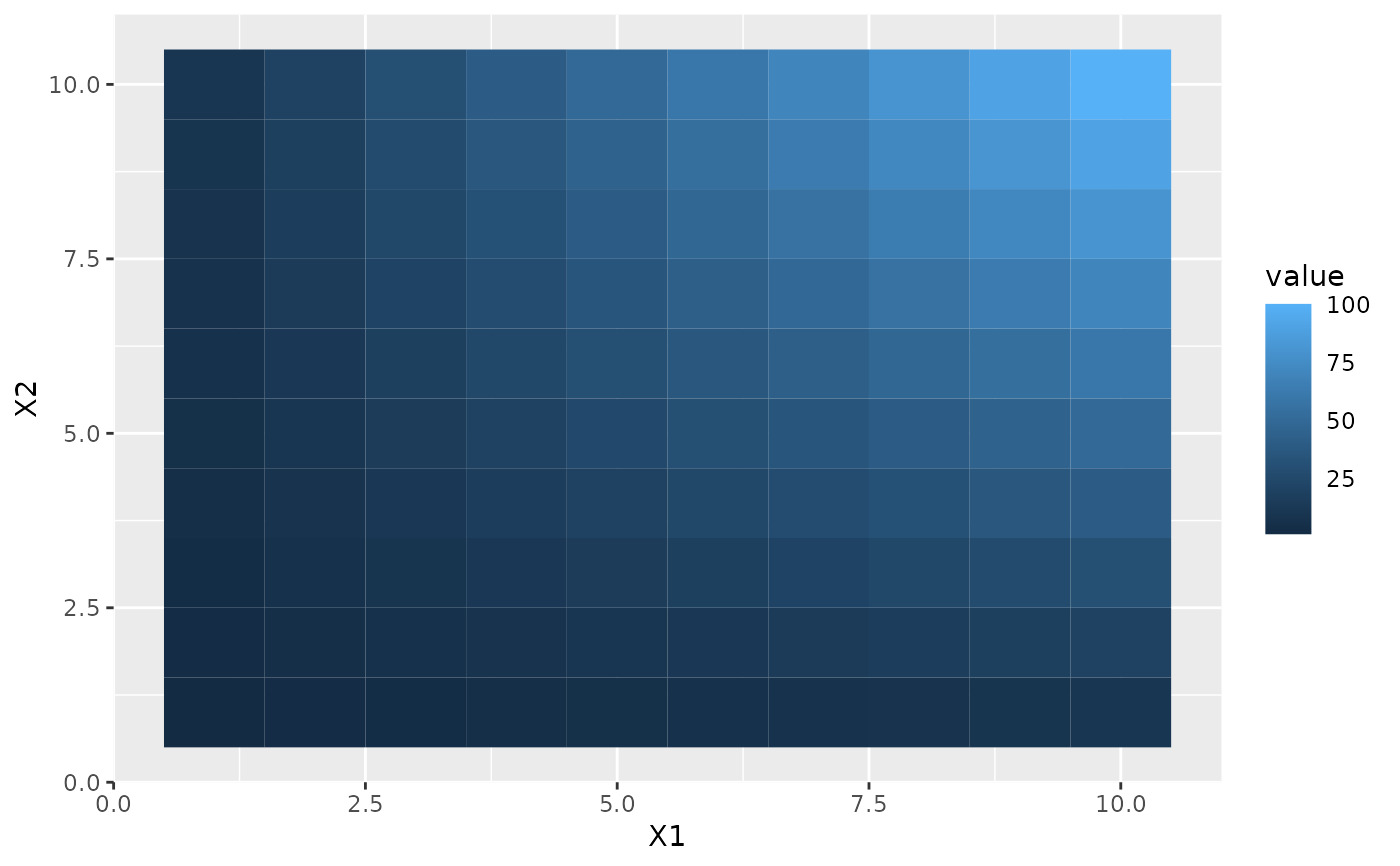
 # no tick marks
p1 + guides(fill = guide_colourbar(ticks = FALSE))
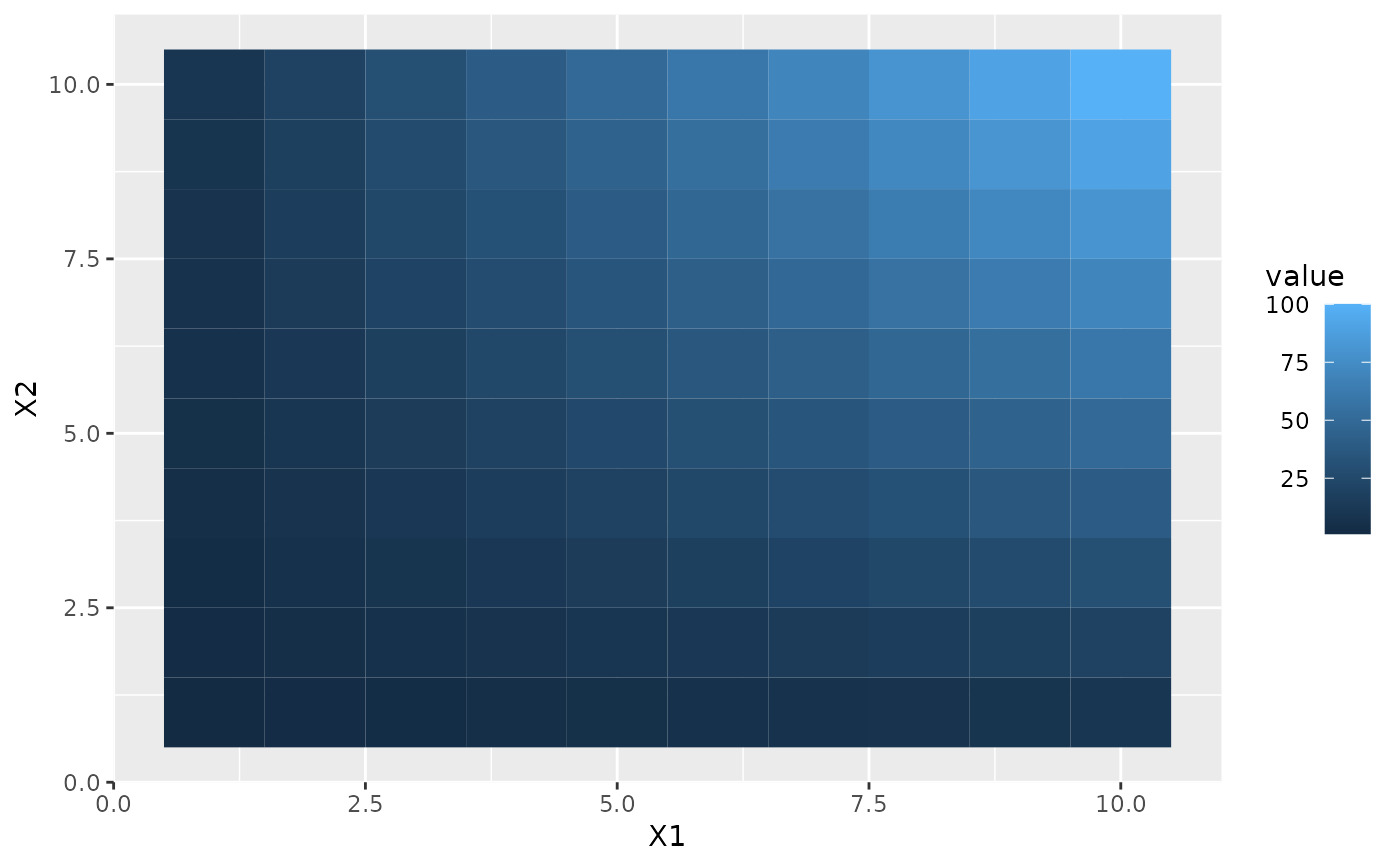
 # label position
p1 + guides(fill = guide_colourbar(label.position = "left"))
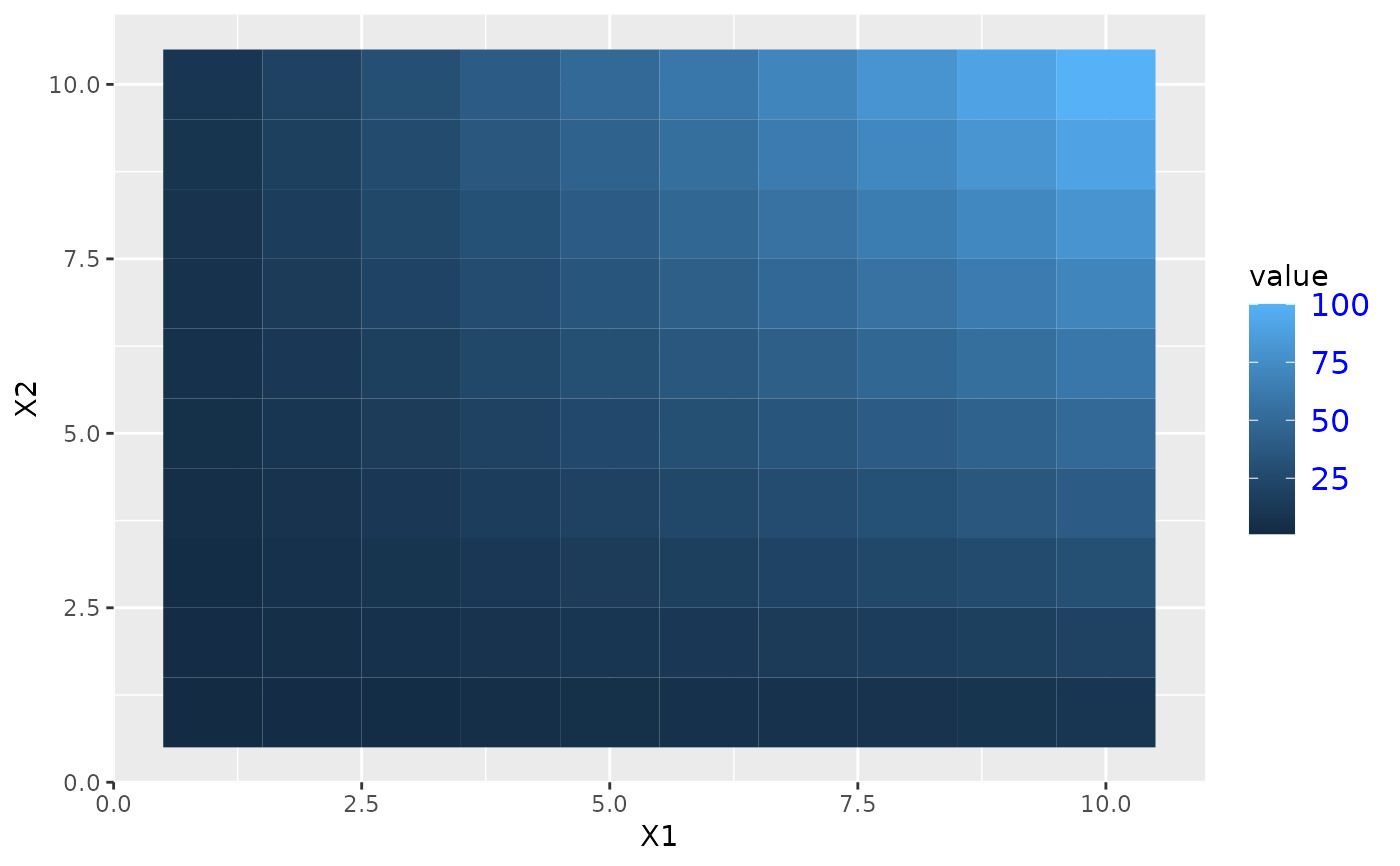
 # label theme
p1 + guides(fill = guide_colourbar(label.theme = element_text(colour = "blue", angle = 0)))
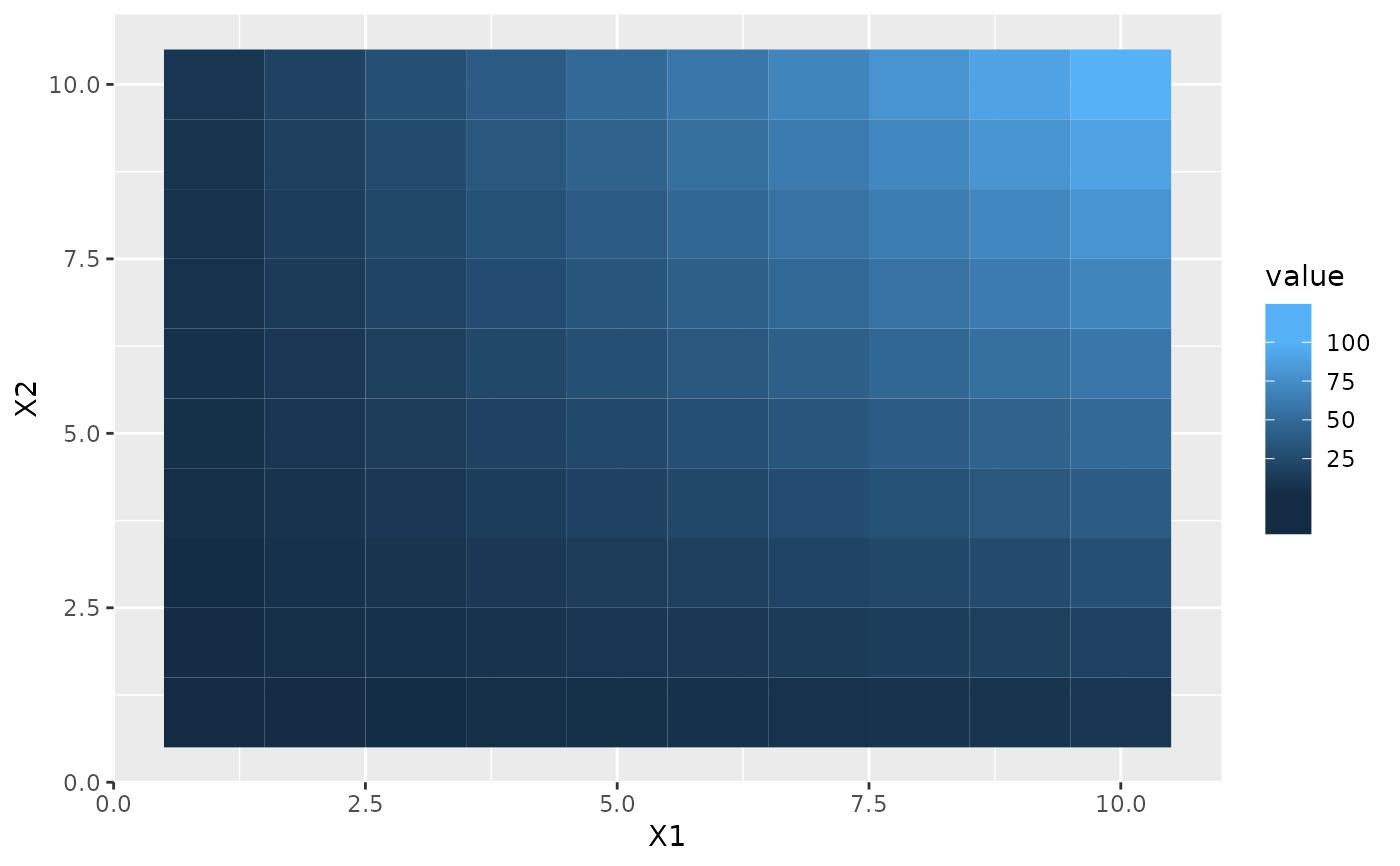
 # small number of bins
p1 + guides(fill = guide_colourbar(nbin = 3))
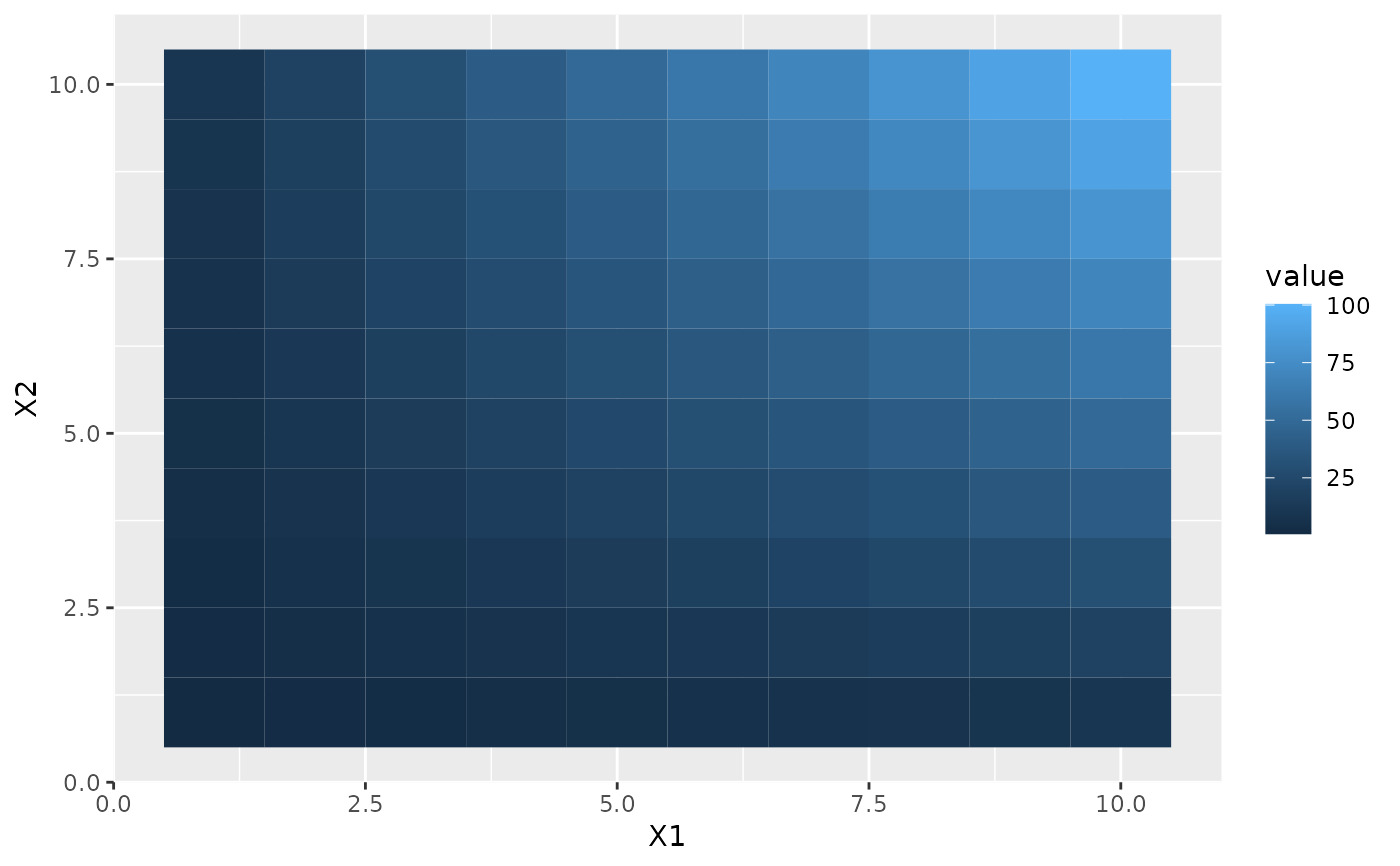
 # large number of bins
p1 + guides(fill = guide_colourbar(nbin = 100))
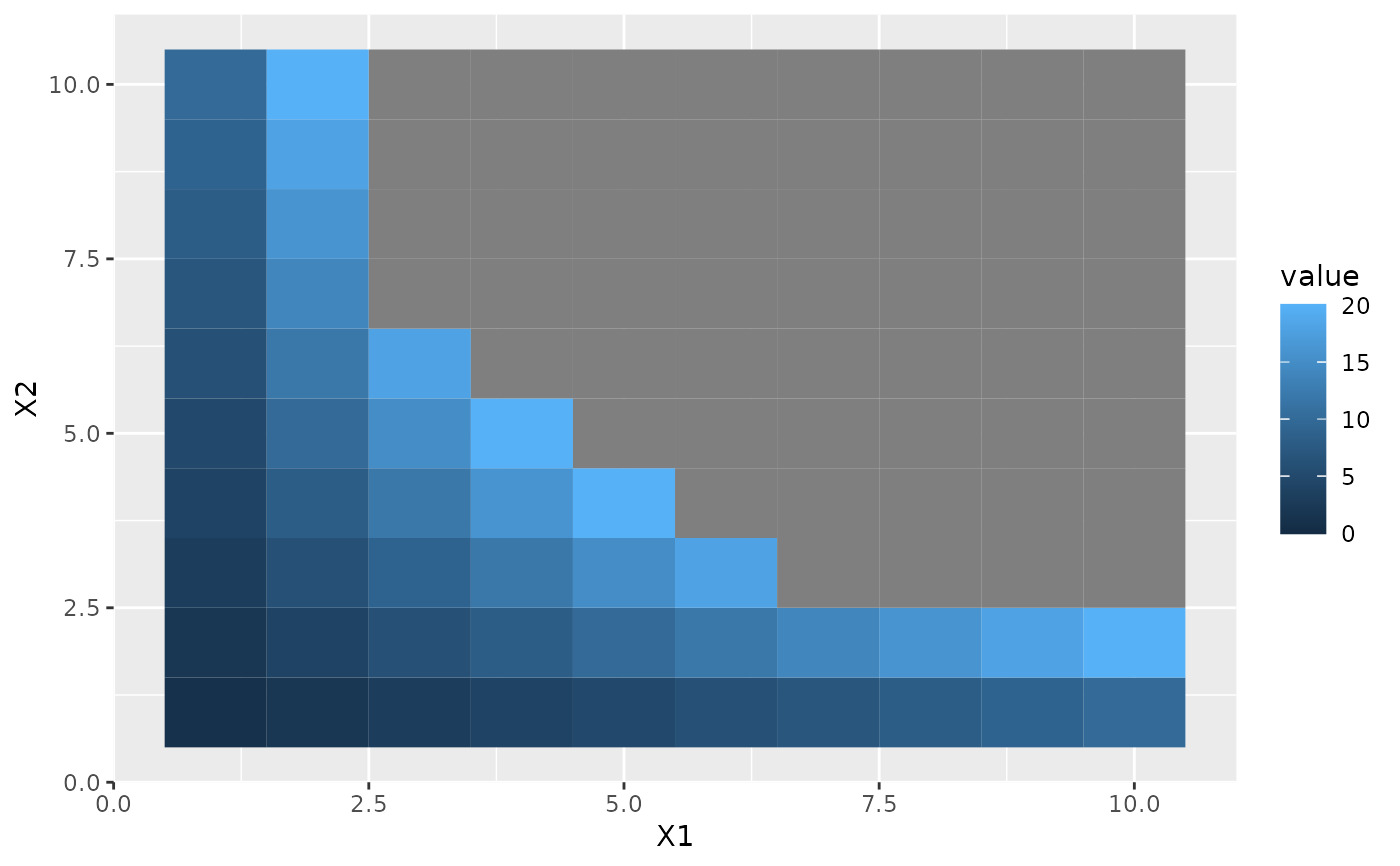
 # make top- and bottom-most ticks invisible
p1 +
scale_fill_continuous(
limits = c(0,20), breaks = c(0, 5, 10, 15, 20),
guide = guide_colourbar(nbin = 100, draw.ulim = FALSE, draw.llim = FALSE)
)
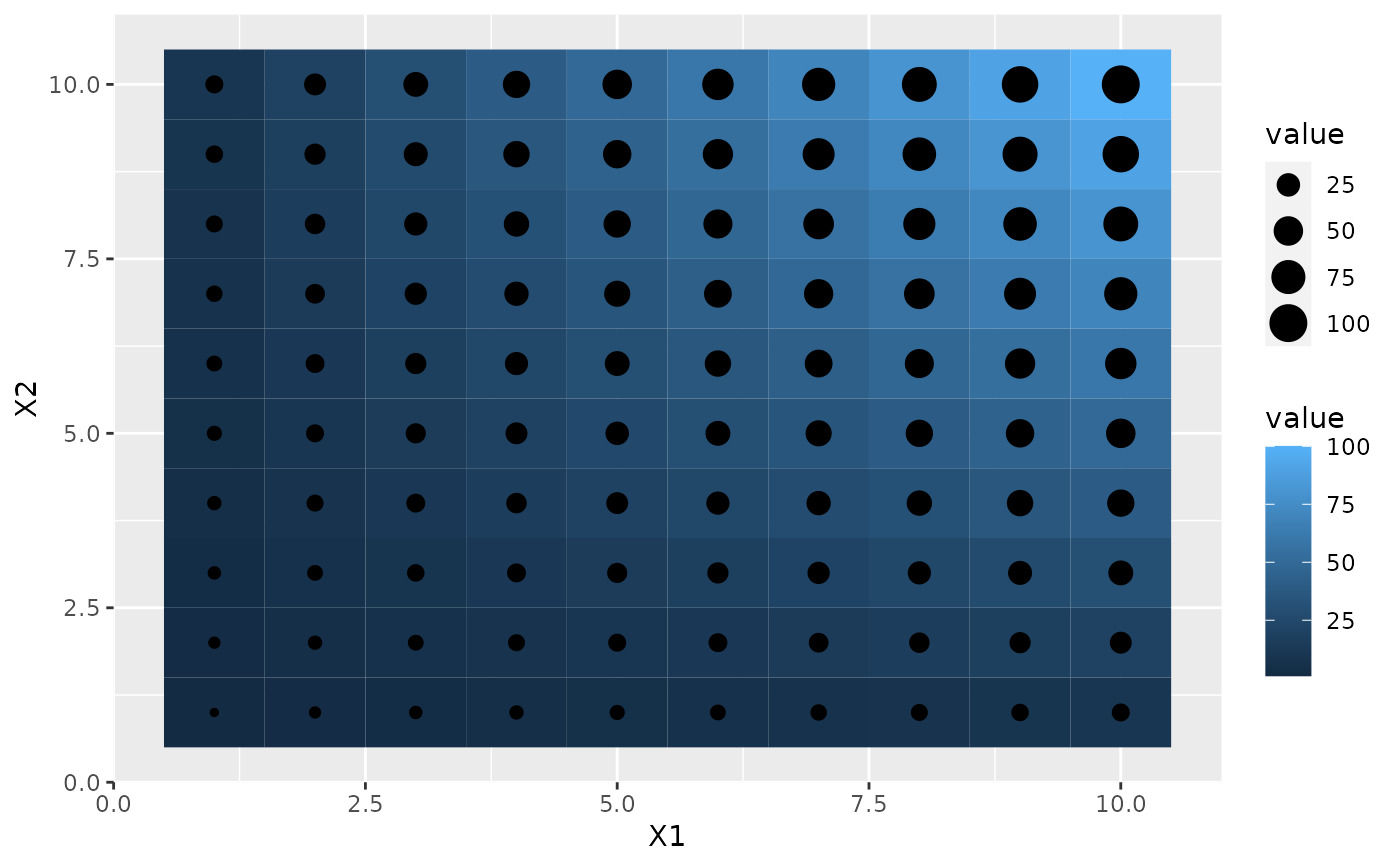
 # guides can be controlled independently
p2 +
scale_fill_continuous(guide = "colourbar") +
scale_size(guide = "legend")
 p2 + guides(fill = "colourbar", size = "legend")
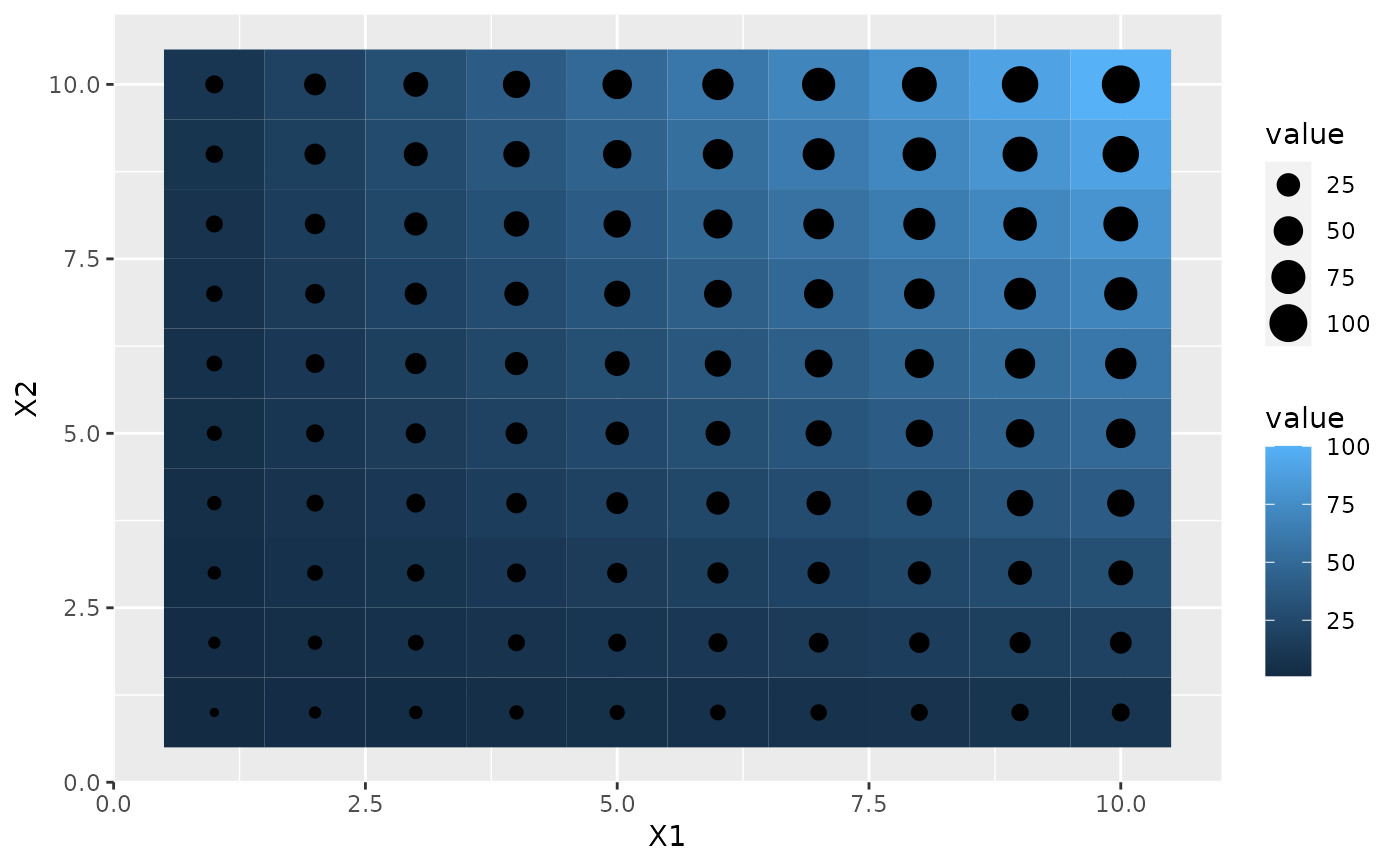 p2 +
scale_fill_continuous(guide = guide_colourbar(direction = "horizontal")) +
scale_size(guide = guide_legend(direction = "vertical"))
相关用法
- R ggplot2 guide_coloursteps 离散颜色条指南
- R ggplot2 guide_legend 图例指南
- R ggplot2 guide_bins Guide_legend 的分箱版本
- R ggplot2 guide_axis 轴导轨
- R ggplot2 guides 为每个尺度设置指南
- R ggplot2 geom_qq 分位数-分位数图
- R ggplot2 geom_spoke 由位置、方向和距离参数化的线段
- R ggplot2 geom_quantile 分位数回归
- R ggplot2 geom_text 文本
- R ggplot2 get_alt_text 从绘图中提取替代文本
- R ggplot2 geom_ribbon 函数区和面积图
- R ggplot2 geom_boxplot 盒须图(Tukey 风格)
- R ggplot2 geom_hex 二维箱计数的六边形热图
- R ggplot2 geom_bar 条形图
- R ggplot2 geom_bin_2d 二维 bin 计数热图
- R ggplot2 ggplot 创建一个新的ggplot
- R ggplot2 geom_jitter 抖动点
- R ggplot2 geom_point 积分
- R ggplot2 geom_linerange 垂直间隔:线、横线和误差线
- R ggplot2 ggsf 可视化 sf 对象
- R ggplot2 geom_blank 什么也不画
- R ggplot2 ggsave 使用合理的默认值保存 ggplot (或其他网格对象)
- R ggplot2 ggtheme 完整的主题
- R ggplot2 geom_path 连接观察结果
- R ggplot2 geom_violin 小提琴情节
注:本文由纯净天空筛选整理自Hadley Wickham等大神的英文原创作品 Continuous colour bar guide。非经特殊声明,原始代码版权归原作者所有,本译文未经允许或授权,请勿转载或复制。
