Glance 接受模型对象并返回 tibble::tibble(),其中仅包含一行模型摘要。摘要通常是拟合优度度量、残差假设检验的 p 值或模型收敛信息。
Glance 永远不会返返回自对建模函数的原始调用的信息。这包括建模函数的名称或传递给建模函数的任何参数。
Glance 不计算汇总度量。相反,它将这些计算外包给适当的方法并将结果收集在一起。有时拟合优度测量是不确定的。在这些情况下,该度量将报告为 NA 。
无论模型矩阵是否秩亏,Glance 都会返回相同的列数。如果是这样,则不再具有明确定义值的列中的条目将使用适当类型的 NA 进行填充。
参数
- x
-
从
survival::survfit()返回的survfit对象。 - ...
-
传递给
summary.survfit()的其他参数。重要参数包括rmean。
也可以看看
glance() , survival::survfit()
其他 cch 整理器:glance.cch() 、tidy.cch()
其他生存整理器:augment.coxph() , augment.survreg() , glance.aareg() , glance.cch() , glance.coxph() , glance.pyears() , glance.survdiff() , glance.survexp() , glance.survreg() , tidy.aareg() , tidy.cch() , tidy.coxph() , tidy.pyears() , tidy.survdiff() , tidy.survexp() , tidy.survfit() , tidy.survreg()
值
恰好只有一行和一列的 tibble::tibble():
- events
-
事件数量。
- n.max
-
处于危险中的受试者的最大数量。
- n.start
-
处于危险中的受试者的初始数量。
- nobs
-
使用的观察数。
- records
-
观察次数
- rmean
-
限制平均值(参见 [survival::print.survfit()])。
- rmean.std.error
-
限制平均标准误。
- conf.low
-
中位数置信区间的下限
- conf.high
-
中位数置信区间的上限
- median
-
中位生存期
例子
# load libraries for models and data
library(survival)
# fit model
cfit <- coxph(Surv(time, status) ~ age + sex, lung)
sfit <- survfit(cfit)
# summarize model fit with tidiers + visualization
tidy(sfit)
#> # A tibble: 186 × 8
#> time n.risk n.event n.censor estimate std.error conf.high conf.low
#> <dbl> <dbl> <dbl> <dbl> <dbl> <dbl> <dbl> <dbl>
#> 1 5 228 1 0 0.996 0.00419 1 0.988
#> 2 11 227 3 0 0.983 0.00845 1.00 0.967
#> 3 12 224 1 0 0.979 0.00947 0.997 0.961
#> 4 13 223 2 0 0.971 0.0113 0.992 0.949
#> 5 15 221 1 0 0.966 0.0121 0.990 0.944
#> 6 26 220 1 0 0.962 0.0129 0.987 0.938
#> 7 30 219 1 0 0.958 0.0136 0.984 0.933
#> 8 31 218 1 0 0.954 0.0143 0.981 0.927
#> 9 53 217 2 0 0.945 0.0157 0.975 0.917
#> 10 54 215 1 0 0.941 0.0163 0.972 0.911
#> # ℹ 176 more rows
glance(sfit)
#> # A tibble: 1 × 10
#> records n.max n.start events rmean rmean.std.error median conf.low
#> <dbl> <dbl> <dbl> <dbl> <dbl> <dbl> <dbl> <dbl>
#> 1 228 228 228 165 381. 20.3 320 285
#> # ℹ 2 more variables: conf.high <dbl>, nobs <int>
library(ggplot2)
ggplot(tidy(sfit), aes(time, estimate)) +
geom_line() +
geom_ribbon(aes(ymin = conf.low, ymax = conf.high), alpha = .25)
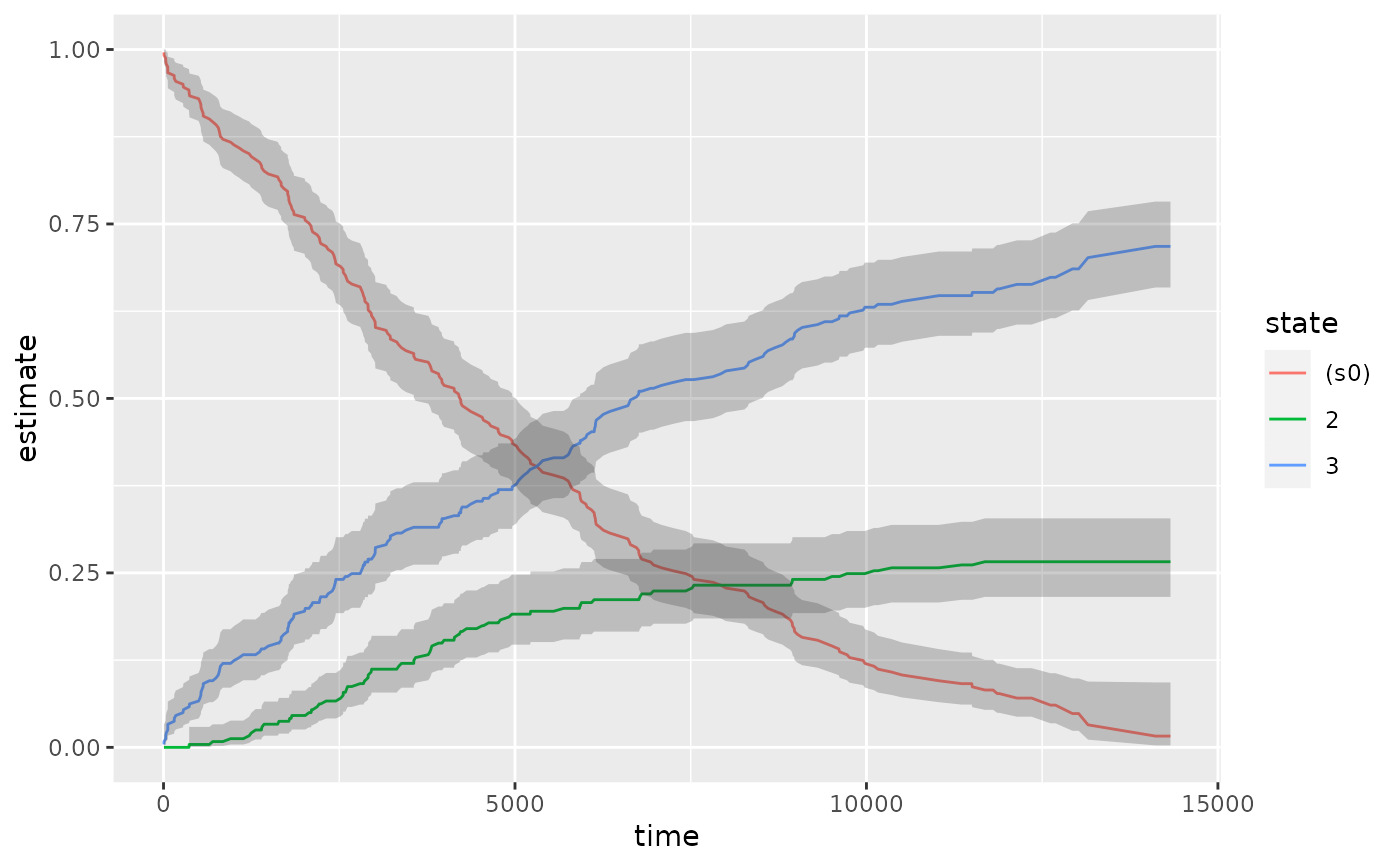
 # multi-state
fitCI <- survfit(Surv(stop, status * as.numeric(event), type = "mstate") ~ 1,
data = mgus1, subset = (start == 0)
)
td_multi <- tidy(fitCI)
td_multi
#> # A tibble: 711 × 9
#> time n.risk n.event n.censor estimate std.error conf.high conf.low
#> <dbl> <int> <int> <int> <dbl> <dbl> <dbl> <dbl>
#> 1 6 241 0 0 0.996 0.00414 1 0.988
#> 2 7 240 0 0 0.992 0.00584 1 0.980
#> 3 31 239 0 0 0.988 0.00714 1 0.974
#> 4 32 238 0 0 0.983 0.00823 1.00 0.967
#> 5 39 237 0 0 0.979 0.00918 0.997 0.961
#> 6 60 236 0 0 0.975 0.0100 0.995 0.956
#> 7 61 235 0 0 0.967 0.0115 0.990 0.944
#> 8 152 233 0 0 0.963 0.0122 0.987 0.939
#> 9 153 232 0 0 0.959 0.0128 0.984 0.934
#> 10 174 231 0 0 0.954 0.0134 0.981 0.928
#> # ℹ 701 more rows
#> # ℹ 1 more variable: state <chr>
ggplot(td_multi, aes(time, estimate, group = state)) +
geom_line(aes(color = state)) +
geom_ribbon(aes(ymin = conf.low, ymax = conf.high), alpha = .25)
# multi-state
fitCI <- survfit(Surv(stop, status * as.numeric(event), type = "mstate") ~ 1,
data = mgus1, subset = (start == 0)
)
td_multi <- tidy(fitCI)
td_multi
#> # A tibble: 711 × 9
#> time n.risk n.event n.censor estimate std.error conf.high conf.low
#> <dbl> <int> <int> <int> <dbl> <dbl> <dbl> <dbl>
#> 1 6 241 0 0 0.996 0.00414 1 0.988
#> 2 7 240 0 0 0.992 0.00584 1 0.980
#> 3 31 239 0 0 0.988 0.00714 1 0.974
#> 4 32 238 0 0 0.983 0.00823 1.00 0.967
#> 5 39 237 0 0 0.979 0.00918 0.997 0.961
#> 6 60 236 0 0 0.975 0.0100 0.995 0.956
#> 7 61 235 0 0 0.967 0.0115 0.990 0.944
#> 8 152 233 0 0 0.963 0.0122 0.987 0.939
#> 9 153 232 0 0 0.959 0.0128 0.984 0.934
#> 10 174 231 0 0 0.954 0.0134 0.981 0.928
#> # ℹ 701 more rows
#> # ℹ 1 more variable: state <chr>
ggplot(td_multi, aes(time, estimate, group = state)) +
geom_line(aes(color = state)) +
geom_ribbon(aes(ymin = conf.low, ymax = conf.high), alpha = .25)
相关用法
- R broom glance.survexp 浏览 a(n) survexp 对象
- R broom glance.survreg 看一眼 survreg 对象
- R broom glance.survdiff 浏览 a(n) survdiff 对象
- R broom glance.summary.lm 浏览一个(n)summary.lm对象
- R broom glance.sarlm 浏览一个(n)spatialreg对象
- R broom glance.svyglm 浏览 svyglm 对象
- R broom glance.speedglm 看一眼 speedglm 对象
- R broom glance.speedlm 扫视一个 speedlm 对象
- R broom glance.svyolr 瞥一眼 svyolr 对象
- R broom glance.smooth.spline 整理一个 smooth.spine 对象
- R broom glance.rlm 浏览 a(n) rlm 对象
- R broom glance.felm 瞥一眼毛毡物体
- R broom glance.geeglm 浏览 a(n) geeglm 对象
- R broom glance.plm 浏览一个 (n) plm 对象
- R broom glance.biglm 浏览 a(n) biglm 对象
- R broom glance.clm 浏览 a(n) clm 对象
- R broom glance.rma 浏览一个(n) rma 对象
- R broom glance.multinom 浏览一个(n)多项对象
- R broom glance.rq 查看 a(n) rq 对象
- R broom glance.mjoint 查看 a(n) mjoint 对象
- R broom glance.fitdistr 浏览 a(n) fitdistr 对象
- R broom glance.glm 浏览 a(n) glm 对象
- R broom glance.coxph 浏览 a(n) coxph 对象
- R broom glance.margins 浏览 (n) 个 margins 对象
- R broom glance.poLCA 浏览一个(n) poLCA 对象
注:本文由纯净天空筛选整理自等大神的英文原创作品 Glance at a(n) survfit object。非经特殊声明,原始代码版权归原作者所有,本译文未经允许或授权,请勿转载或复制。