本文简要介绍 python 语言中 scipy.stats.differential_entropy 的用法。
用法:
scipy.stats.differential_entropy(values, *, window_length=None, base=None, axis=0, method='auto')#给定一个分布样本,估计微分熵。
使用方法参数可以使用几种估计方法。默认情况下,根据样本大小选择方法。
- values: 序列
来自连续分布的样本。
- window_length: 整数,可选
用于计算 Vasicek 估计的窗口长度。必须是介于 1 和样本大小一半之间的整数。如果
None(默认),它使用启发式值其中 是样本大小。这种启发式方法最初是在 [2] 中提出的,并且在文献中很常见。
- base: 浮点数,可选
要使用的对数底数,默认为
e(自然对数)。- axis: 整数,可选
计算微分熵的轴。默认值为 0。
- method: {‘vasicek’,'van es',‘ebrahimi’, ‘correa’, ‘auto’},可选
用于从样本中估计微分熵的方法。默认为
'auto'。有关详细信息,请参阅注释。
- entropy: 浮点数
计算出的微分熵。
参数 ::
返回 ::
注意:
该函数将收敛到极限内的真实微分熵
对于给定样本大小,
window_length的最佳选择取决于(未知)分布。通常,分布密度越平滑,window_length的最佳值就越大[1]。以下选项可用于方法参数。
'vasicek'使用 [1] 中提供的估计器。这是微分熵的第一个也是最有影响的估计量之一。'van es'使用 [3] 中提出的偏差校正估计量,它不仅是一致的,而且在某些条件下是渐近正态的。'ebrahimi'使用 [4] 中提出的估计器,在仿真中显示该估计器比 Vasicek 估计器具有更小的偏差和均方误差。'correa'使用 [5] 中基于局部线性回归的估计器。在模拟研究中,它的均方误差始终小于 Vasiceck 估计器,但计算成本更高。'auto'自动选择方法(默认)。目前,对于非常小的样本 (<10) 选择'van es',对于中等样本大小 (11-1000) 选择'ebrahimi',对于较大的样本选择'vasicek',但此行为在未来版本中可能会发生变化。
所有估计器都按照 [6] 中的说明实现。
参考:
[1] (1,2)瓦西切克,O. (1976)。基于样本熵的正态性检验。皇家统计学会杂志:B 系列(方法论),38(1),54-59。
[2]Crzcgorzewski, P. 和 Wirczorkowski, R. (1999)。基于熵的goodness-of-fit index 测试。 Statistics-Theory 和方法中的通信,28(5),1183-1202。
[3]Van Es, B. (1992)。通过基于间距的一类统计来估计与密度相关的泛函。斯堪的纳维亚统计杂志,61-72。
[4]Ebrahimi, N.、Pflughoeft, K. 和 Soofi, E. S. (1994)。样本熵的两种度量。统计与概率快报,20(3),225-234。
[5]Correa, J. C. (1995)。一种新的熵估计量。 Statistics-Theory 和方法中的通信,24(10), 2439-2449。
[6]Noughabi, H. A. (2015)。使用数值方法进行熵估计。数据科学年鉴,2(2),231-241。https://link.springer.com/article/10.1007/s40745-015-0045-9
例子:
>>> import numpy as np
>>> from scipy.stats import differential_entropy, norm
标准正态分布的熵:
>>> rng = np.random.default_rng()
>>> values = rng.standard_normal(100)
>>> differential_entropy(values)
1.3407817436640392
与真实熵比较:
>>> float(norm.entropy())
1.4189385332046727
对于 5 到 1000 之间的几个样本大小,比较
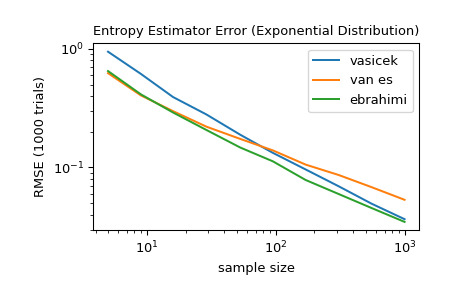
'vasicek'、'van es'和'ebrahimi'方法的准确性。具体来说,比较估计值和分布的真实微分熵之间的均方根误差(超过 1000 次试验)。>>> from scipy import stats >>> import matplotlib.pyplot as plt >>> >>> >>> def rmse(res, expected): ... '''Root mean squared error''' ... return np.sqrt(np.mean((res - expected)**2)) >>> >>> >>> a, b = np.log10(5), np.log10(1000) >>> ns = np.round(np.logspace(a, b, 10)).astype(int) >>> reps = 1000 # number of repetitions for each sample size >>> expected = stats.expon.entropy() >>> >>> method_errors = {'vasicek': [], 'van es': [], 'ebrahimi': []} >>> for method in method_errors: ... for n in ns: ... rvs = stats.expon.rvs(size=(reps, n), random_state=rng) ... res = stats.differential_entropy(rvs, method=method, axis=-1) ... error = rmse(res, expected) ... method_errors[method].append(error) >>> >>> for method, errors in method_errors.items(): ... plt.loglog(ns, errors, label=method) >>> >>> plt.legend() >>> plt.xlabel('sample size') >>> plt.ylabel('RMSE (1000 trials)') >>> plt.title('Entropy Estimator Error (Exponential Distribution)')
相关用法
- Python SciPy stats.directional_stats用法及代码示例
- Python SciPy stats.dirichlet_multinomial用法及代码示例
- Python SciPy stats.dirichlet用法及代码示例
- Python SciPy stats.dweibull用法及代码示例
- Python SciPy stats.dunnett用法及代码示例
- Python SciPy stats.dgamma用法及代码示例
- Python SciPy stats.describe用法及代码示例
- Python SciPy stats.dlaplace用法及代码示例
- Python SciPy stats.anderson用法及代码示例
- Python SciPy stats.iqr用法及代码示例
- Python SciPy stats.genpareto用法及代码示例
- Python SciPy stats.skewnorm用法及代码示例
- Python SciPy stats.cosine用法及代码示例
- Python SciPy stats.norminvgauss用法及代码示例
- Python SciPy stats.invwishart用法及代码示例
- Python SciPy stats.bartlett用法及代码示例
- Python SciPy stats.levy_stable用法及代码示例
- Python SciPy stats.page_trend_test用法及代码示例
- Python SciPy stats.itemfreq用法及代码示例
- Python SciPy stats.exponpow用法及代码示例
- Python SciPy stats.gumbel_l用法及代码示例
- Python SciPy stats.chisquare用法及代码示例
- Python SciPy stats.semicircular用法及代码示例
- Python SciPy stats.gzscore用法及代码示例
- Python SciPy stats.gompertz用法及代码示例
注:本文由纯净天空筛选整理自scipy.org大神的英文原创作品 scipy.stats.differential_entropy。非经特殊声明,原始代码版权归原作者所有,本译文未经允许或授权,请勿转载或复制。
