contour3 生成在矩形网格上定义的表面的 3 维等高线图。
用法
contour3(Z) // It draws a contour plot of matrix Z in a three-dimensional view. Z is interpreted as heights concerning the x-y plane.
contour3(Z,n) // It draws a contour plot of matrix Z with n contour levels in a three-dimensional view.
contour3(Z,v) // It draws a contour plot of the matrix Z with contour lines at the values specified in vector v. The number of contour levels is similar to length(v).
contour3(X,Y,Z) // It specifies the x and y coordinates for the values in Z.
contour3(X,Y,Z,n)
contour3(X,Y,Z,v)
contour3(...,LineSpec) // It draws the contours using the line type and color specified by Line Spec.
[C,h] = contour3(...) // It returns the contour matrix C as described in the function contour c and a column vector containing handles to graphics objects.
示例
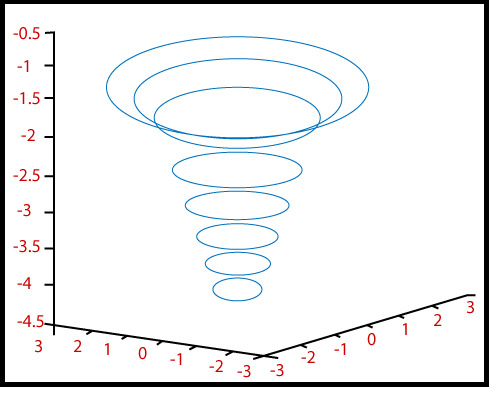
3-D 等高线图
z=-5/(1+x^2+y^2 )
|x|â¤3,|y|â¤3.
r=linspace (-3, 3, 50);
[x, y]=meshgrid (r, r);
z= -5./(1+x.^2+y.^2);
contour3 (x, y, z)输出:
相关用法
- MATLAB contour()用法及代码示例
- MATLAB comet()用法及代码示例
- MATLAB compass()用法及代码示例
- MATLAB cylinder()用法及代码示例
- MATLAB meshz()用法及代码示例
- MATLAB loglog()用法及代码示例
- MATLAB ribbon()用法及代码示例
- MATLAB Stairs()用法及代码示例
- MATLAB pcolor()用法及代码示例
- MATLAB Bar()用法及代码示例
- MATLAB barh()用法及代码示例
- MATLAB area()用法及代码示例
- MATLAB stem3()用法及代码示例
- MATLAB waterfall()用法及代码示例
- MATLAB quiver()用法及代码示例
- MATLAB slice()用法及代码示例
- MATLAB Semilogy()用法及代码示例
- MATLAB plotyy()用法及代码示例
- MATLAB fill3()用法及代码示例
- MATLAB fill()用法及代码示例
注:本文由纯净天空筛选整理自 MATLAB contour3()。非经特殊声明,原始代码版权归原作者所有,本译文未经允许或授权,请勿转载或复制。