三维茎图显示从 xy-plane 延伸的线。 z-position 描述数据值的圆圈(默认)或其他标记符号终止每个词干。
用法
stem3(Z) // It plots the data sequence Z as stems that extend from the xy-plane.
stem3(X, Y, Z) // It plots the data sequence Z at the value specified by X and Y. X, Y, and Z must be all be vectors or matrices of the same size.
stem3(...,'fill')  // It specifies whether to color the interior of the circle at the end of the stem.
stem3(...,LineSpec) // It specifies the line style, marker symbol, and color for the stems.
h = stem3(...) // It returns handles to line graphics objects.
示例
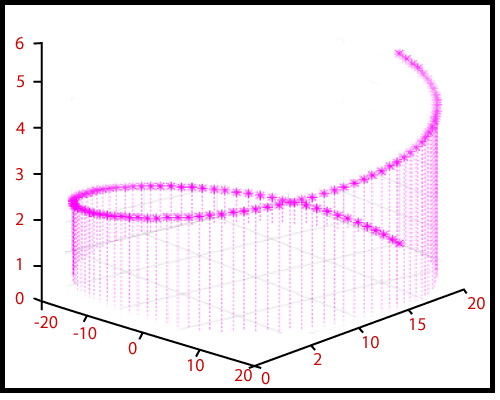
创建一个三维茎图来可视化两个变量的函数。
x=t, y=tsin(t)
z=e^t/10-1
for 0â¤tâ¤6Ď
t=linspace(0,6*pi,200);
x=t; y=t.*sin(t);
z=exp(t/10)-1;
stem3(x, y, z,'filled')输出:
相关用法
- MATLAB stem()用法及代码示例
- MATLAB slice()用法及代码示例
- MATLAB surf()用法及代码示例
- MATLAB sphere()用法及代码示例
- MATLAB surfc()用法及代码示例
- MATLAB meshz()用法及代码示例
- MATLAB contour()用法及代码示例
- MATLAB loglog()用法及代码示例
- MATLAB ribbon()用法及代码示例
- MATLAB comet()用法及代码示例
- MATLAB Stairs()用法及代码示例
- MATLAB pcolor()用法及代码示例
- MATLAB Bar()用法及代码示例
- MATLAB contour3()用法及代码示例
- MATLAB barh()用法及代码示例
- MATLAB area()用法及代码示例
- MATLAB waterfall()用法及代码示例
- MATLAB quiver()用法及代码示例
- MATLAB Semilogy()用法及代码示例
- MATLAB plotyy()用法及代码示例
注:本文由纯净天空筛选整理自 MATLAB stem3()。非经特殊声明,原始代码版权归原作者所有,本译文未经允许或授权,请勿转载或复制。