阶梯图可用于绘制数字 sampled-record 系统的时间历史图。
用法
stairs(Y) // It draws a stairstep plot of the items of Y. When Y is the vector, the x-axis scale range from 1 to the size(Y). When Y is the matrix, the x-axis scale range from 1 to the number of rows in Y
stairs(X,Y) // It plots X versus the columns of Y. X and Y are vectors of a similar size or matrices of a similar size. X can be the row or a column vector, and Y a matrix with length(X) rows.
stairs(...,LineSpec) // It specifies a-line style, marker symbol, and color for the plots.
示例
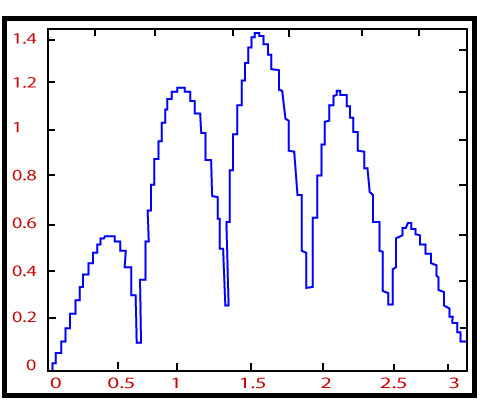
创建一个情节
r^2=2sin5t,0â¤tâ¤2Ď
y= r sin t
t=linspace(0,2*pi,200);
r=sqrt(abs(2*sin(5*t)));
y=r.*sin(t);
stairs(t, y);
axis[0 pi 0 inf]);输出:
相关用法
- MATLAB Semilogy()用法及代码示例
- MATLAB Semilogx()用法及代码示例
- MATLAB meshz()用法及代码示例
- MATLAB contour()用法及代码示例
- MATLAB loglog()用法及代码示例
- MATLAB ribbon()用法及代码示例
- MATLAB comet()用法及代码示例
- MATLAB pcolor()用法及代码示例
- MATLAB Bar()用法及代码示例
- MATLAB contour3()用法及代码示例
- MATLAB barh()用法及代码示例
- MATLAB area()用法及代码示例
- MATLAB stem3()用法及代码示例
- MATLAB waterfall()用法及代码示例
- MATLAB quiver()用法及代码示例
- MATLAB slice()用法及代码示例
- MATLAB plotyy()用法及代码示例
- MATLAB fill3()用法及代码示例
- MATLAB fill()用法及代码示例
- MATLAB cylinder()用法及代码示例
注:本文由纯净天空筛选整理自 MATLAB Stairs()。非经特殊声明,原始代码版权归原作者所有,本译文未经允许或授权,请勿转载或复制。