对于绘制填充多边形,我们可以使用 fill() 函数。顶点与要填充的颜色一起记录。
用法
fill(x,y,)	// It creates filled polygons from the data specified by x and y with color c.
fill(x1,y1,c1....xN,yN,cN)	// It specifies multiple 2-D filled areas
fill(x,y,colorspec)	// It fills 2-D polygons specified by X and Y with the color specified by colorspec.
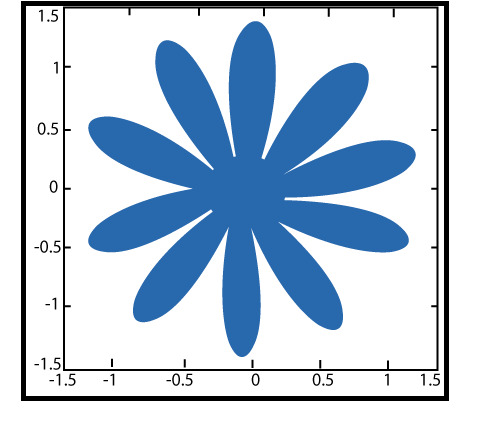
示例
r^2=2sin5t,0â¤tâ¤2Ď
x=r cost,y=r sint
t=linspace (0, 2*pi,200);
r=sqrt(abs(2*sin(5*t)));
x=r.*cos(t);
y=r.*sin(t);
fill(x, y, 'k');
axis('square')输出:

相关用法
- MATLAB fill3()用法及代码示例
- MATLAB meshz()用法及代码示例
- MATLAB contour()用法及代码示例
- MATLAB loglog()用法及代码示例
- MATLAB ribbon()用法及代码示例
- MATLAB comet()用法及代码示例
- MATLAB Stairs()用法及代码示例
- MATLAB pcolor()用法及代码示例
- MATLAB Bar()用法及代码示例
- MATLAB contour3()用法及代码示例
- MATLAB barh()用法及代码示例
- MATLAB area()用法及代码示例
- MATLAB stem3()用法及代码示例
- MATLAB waterfall()用法及代码示例
- MATLAB quiver()用法及代码示例
- MATLAB slice()用法及代码示例
- MATLAB Semilogy()用法及代码示例
- MATLAB plotyy()用法及代码示例
- MATLAB cylinder()用法及代码示例
- MATLAB ellipsoid()用法及代码示例
注:本文由纯净天空筛选整理自 MATLAB fill()。非经特殊声明,原始代码版权归原作者所有,本译文未经允许或授权,请勿转载或复制。
