彗星图是一个动画图形,其中一个圆圈在屏幕上跟踪数据点。
用法
comet(y) // It displays a comet plot of the vector y.
comet(x,y) // It displays a comet plot of vector y versus vector x.
comet(x,y,p) // It specifies a comet body of length p*length(y). p defaults to 0.1.
示例
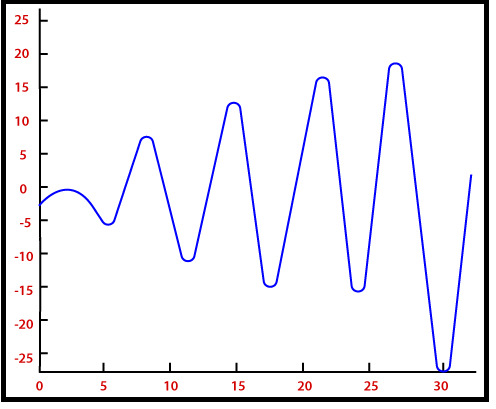
y=t sint,0â¤tâ¤10Ď
q=linspace(0, 10*pi,2000);
y=q.*sin(q);
comet (q, y)输出:
相关用法
- MATLAB compass()用法及代码示例
- MATLAB contour()用法及代码示例
- MATLAB contour3()用法及代码示例
- MATLAB cylinder()用法及代码示例
- MATLAB meshz()用法及代码示例
- MATLAB loglog()用法及代码示例
- MATLAB ribbon()用法及代码示例
- MATLAB Stairs()用法及代码示例
- MATLAB pcolor()用法及代码示例
- MATLAB Bar()用法及代码示例
- MATLAB barh()用法及代码示例
- MATLAB area()用法及代码示例
- MATLAB stem3()用法及代码示例
- MATLAB waterfall()用法及代码示例
- MATLAB quiver()用法及代码示例
- MATLAB slice()用法及代码示例
- MATLAB Semilogy()用法及代码示例
- MATLAB plotyy()用法及代码示例
- MATLAB fill3()用法及代码示例
- MATLAB fill()用法及代码示例
注:本文由纯净天空筛选整理自 MATLAB comet()。非经特殊声明,原始代码版权归原作者所有,本译文未经允许或授权,请勿转载或复制。