它使用 x 的线性标度和 y 的对数标度生成 x 和 y 值的图。
用法
semilogy(Y) //	It generates a plot using a base 10 logarithmic scales for the y-axis and linear scales for the x-axis. It plots the column of Y versus their index.
semilogy(X1,Y1,...)//	     It plots all Yn versus Xn pairs.
semilogy(X1,Y1,LineSpec,...)// It plots all the lines described by the Xn,Yn,LineSpec triples. LineSpec determine line style, marker symbol, and color of the plotted lines.
semilogy(...,'PropertyName',PropertyValue,...)//  It sets property values for all the charting lines created by semilogy.
semilogy(ax,...)//     It generates the line in the axes specified by ax instead of in the current axes (gca). The option ax precedes any of the input argument combinations in the previous syntaxes.
h = semilogy(...)//   It returns a vector of chart line objects.
示例
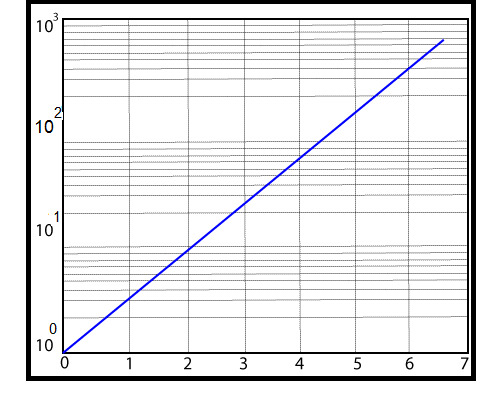
创建一个图形,y 轴为对数刻度,x 轴为线性刻度。
x=t,y=e^t,0≤t≤2π
t=linspace (0, 2*pi,200);
semilogy(t, exp(t))
grid
输出:
相关用法
- MATLAB Semilogx()用法及代码示例
- MATLAB Stairs()用法及代码示例
- MATLAB meshz()用法及代码示例
- MATLAB contour()用法及代码示例
- MATLAB loglog()用法及代码示例
- MATLAB ribbon()用法及代码示例
- MATLAB comet()用法及代码示例
- MATLAB pcolor()用法及代码示例
- MATLAB Bar()用法及代码示例
- MATLAB contour3()用法及代码示例
- MATLAB barh()用法及代码示例
- MATLAB area()用法及代码示例
- MATLAB stem3()用法及代码示例
- MATLAB waterfall()用法及代码示例
- MATLAB quiver()用法及代码示例
- MATLAB slice()用法及代码示例
- MATLAB plotyy()用法及代码示例
- MATLAB fill3()用法及代码示例
- MATLAB fill()用法及代码示例
- MATLAB cylinder()用法及代码示例
注:本文由纯净天空筛选整理自 MATLAB Semilogy()。非经特殊声明,原始代码版权归原作者所有,本译文未经允许或授权,请勿转载或复制。