此函数创建一个水平条形图,x 中的值用于标记每个条形,y 中的值用于确定条形的水平长度。
用法
barh(y) // It creates a horizontal bar graph with one bar for each element in y. If y is an m-by-n matrix, then barh creates m groups of n bars.
barh(x,y)// It draws the bars along the vertical axis at the locations specified by x.
示例
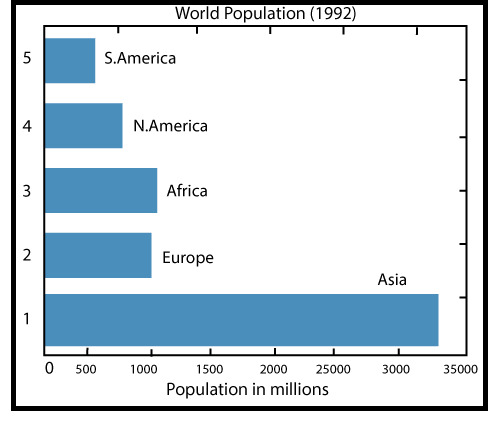
World population by continents
cont=char ('Asia','Europe','Africa',...'N.America','S.America');
pop=[333.2;696;694;437;307];
barh(pop)
for i=1:5,
	gtext(cont(i,:));
end
xlabel('Population in millions');
Title (World population (1992)','fontsize', 18)
输出:
相关用法
- MATLAB meshz()用法及代码示例
- MATLAB contour()用法及代码示例
- MATLAB loglog()用法及代码示例
- MATLAB ribbon()用法及代码示例
- MATLAB comet()用法及代码示例
- MATLAB Stairs()用法及代码示例
- MATLAB pcolor()用法及代码示例
- MATLAB Bar()用法及代码示例
- MATLAB contour3()用法及代码示例
- MATLAB area()用法及代码示例
- MATLAB stem3()用法及代码示例
- MATLAB waterfall()用法及代码示例
- MATLAB quiver()用法及代码示例
- MATLAB slice()用法及代码示例
- MATLAB Semilogy()用法及代码示例
- MATLAB plotyy()用法及代码示例
- MATLAB fill3()用法及代码示例
- MATLAB fill()用法及代码示例
- MATLAB cylinder()用法及代码示例
- MATLAB ellipsoid()用法及代码示例
注:本文由纯净天空筛选整理自 MATLAB barh()。非经特殊声明,原始代码版权归原作者所有,本译文未经允许或授权,请勿转载或复制。