伪彩色图是由 C 保持颜色的矩形单元格阵列。
用法
pcolor(C) // It draw a pseudocolor plot. The items of C are linearly mapped to an index into the current colormap.
pcolor(X,Y,C) // It draw a pseudocolor plot of the items of C at the locations stated by X and Y. The plot is the logically rectangular, two-dimensional grid with vertices at the points [X(i,j), Y(i,j)].
h = pcolor(...) // It returns a handle to a surface graphic object.
示例
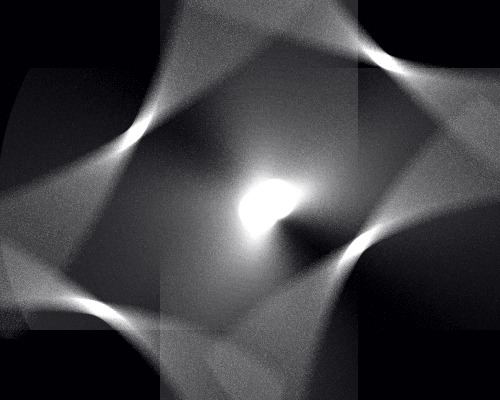
z^2=x^2+y^2-5 sin?(xy)
|x|â¤2,|y|â¤2.
r=-2:.2:2;
[X, Y]= meshgrid (r, r);
Z=X.^2- 5*sin(X.*Y)+Y.^2;
pcolor(Z), axis('off')
shading interp输出:
相关用法
- MATLAB plotyy()用法及代码示例
- MATLAB plot3()用法及代码示例
- MATLAB meshz()用法及代码示例
- MATLAB contour()用法及代码示例
- MATLAB loglog()用法及代码示例
- MATLAB ribbon()用法及代码示例
- MATLAB comet()用法及代码示例
- MATLAB Stairs()用法及代码示例
- MATLAB Bar()用法及代码示例
- MATLAB contour3()用法及代码示例
- MATLAB barh()用法及代码示例
- MATLAB area()用法及代码示例
- MATLAB stem3()用法及代码示例
- MATLAB waterfall()用法及代码示例
- MATLAB quiver()用法及代码示例
- MATLAB slice()用法及代码示例
- MATLAB Semilogy()用法及代码示例
- MATLAB fill3()用法及代码示例
- MATLAB fill()用法及代码示例
- MATLAB cylinder()用法及代码示例
注:本文由纯净天空筛选整理自 MATLAB pcolor()。非经特殊声明,原始代码版权归原作者所有,本译文未经允许或授权,请勿转载或复制。