面积图将 Y 中的项目显示为一条或多条曲线,并填充每条曲线下方的区域。当 Y 为矩阵时,曲线堆叠,显示每个行项目在每个 x 间隔处对曲线总高度的相对贡献。
用法
area(Y) //  It plot the vector Y or the sum of the each column in a matrix Y. The x-axis automatically scales depending on the length(Y) when Y is the vector and on size(Y,1)when Y is the matrix.
area(X,Y) // It plot Y at the corresponding values of X. If X is a vector, length(X) must be the same length(Y), and X must be the monotonic. If X is the matrix, size(X) must similar size(Y), and each column in X must be monotonic.
area(...,ymin) // It specifies the lower limit in the y-direction for the area fill. The default ymin is 0.
area(...,'PropertyName',PropertyValue,...) // It specifies property name and property value pairs for the patch graphics object developed by area.
h = area(...) // It returns handles of patch graphics objects. area generates one patch object per column in Y.
示例
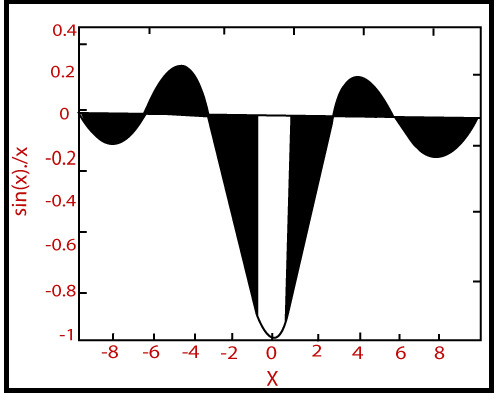
y=sinx/x,-3π≤x≤3π
x=linspace (-3*pi, 3*pi, 100);
y=-sin(x)./x;
area(x, y)
xlabel('x'),ylabel('sin(x)./x')
hold on
x1=x(46:55);y1=y(46:55);
area(x1,y1,'facecolor','y')
输出:
相关用法
- MATLAB meshz()用法及代码示例
- MATLAB contour()用法及代码示例
- MATLAB loglog()用法及代码示例
- MATLAB ribbon()用法及代码示例
- MATLAB comet()用法及代码示例
- MATLAB Stairs()用法及代码示例
- MATLAB pcolor()用法及代码示例
- MATLAB Bar()用法及代码示例
- MATLAB contour3()用法及代码示例
- MATLAB barh()用法及代码示例
- MATLAB stem3()用法及代码示例
- MATLAB waterfall()用法及代码示例
- MATLAB quiver()用法及代码示例
- MATLAB slice()用法及代码示例
- MATLAB Semilogy()用法及代码示例
- MATLAB plotyy()用法及代码示例
- MATLAB fill3()用法及代码示例
- MATLAB fill()用法及代码示例
- MATLAB cylinder()用法及代码示例
- MATLAB ellipsoid()用法及代码示例
注:本文由纯净天空筛选整理自 MATLAB area()。非经特殊声明,原始代码版权归原作者所有,本译文未经允许或授权,请勿转载或复制。