它创建了一个函数区图。
用法
ribbon(Y) // It plots the columns of Y as separate three-dimensional ribbons using
X = 1:size(Y,1).
ribbon(X,Y) // It plots X versus the columns of Y as three-dimensional strips. X and Y are vectors of a similar size or matrices of the same size. X can be the row or a column vector, and Y a matrix with length(X) rows.
ribbon(X,Y,width) // It specifies the width of the ribbons. The default is 0.75.
ribbon(axes_handle,...) // It plots into the axes with handle axes_handle instead of the current axes (gca).
h = ribbon(...) // It returns a vector of handles to surface graphics objects. ribbon returns one handle per strip.
示例
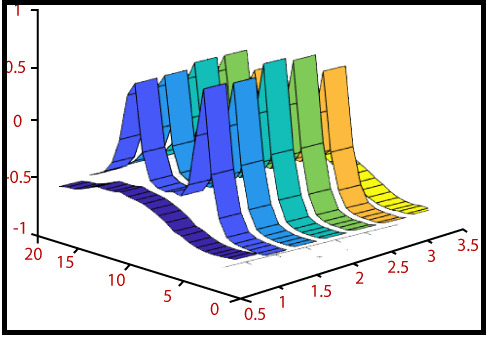
创建函数区图
2-D 曲线作为 3-D 中的色带。
y_1=sin?(t),y_2=e^(-.15t) sin?(t)
y_3=e^(-.8t) sin?(t)
for 0≤t≤5π
t=linspace (0, 5*pi, 100);
y1=sin(t);
y2=exp(-.15*t).*sin(t);
y3=exp(-.8*t).*sin(t);
y=[y1;y2;y3];
rib_width=0.2;
ribbon(t',y',rib_width)
输出:
相关用法
- MATLAB meshz()用法及代码示例
- MATLAB contour()用法及代码示例
- MATLAB loglog()用法及代码示例
- MATLAB comet()用法及代码示例
- MATLAB Stairs()用法及代码示例
- MATLAB pcolor()用法及代码示例
- MATLAB Bar()用法及代码示例
- MATLAB contour3()用法及代码示例
- MATLAB barh()用法及代码示例
- MATLAB area()用法及代码示例
- MATLAB stem3()用法及代码示例
- MATLAB waterfall()用法及代码示例
- MATLAB quiver()用法及代码示例
- MATLAB slice()用法及代码示例
- MATLAB Semilogy()用法及代码示例
- MATLAB plotyy()用法及代码示例
- MATLAB fill3()用法及代码示例
- MATLAB fill()用法及代码示例
- MATLAB cylinder()用法及代码示例
- MATLAB ellipsoid()用法及代码示例
注:本文由纯净天空筛选整理自 MATLAB ribbon()。非经特殊声明,原始代码版权归原作者所有,本译文未经允许或授权,请勿转载或复制。