如果模型數據中缺少值,您可能需要使用 na.action = na.exclude 重新擬合模型。
值
帶有額外列的原始數據:
- .hat
-
帽子矩陣的對角線
- .sigma
-
從模型中刪除相應觀測值時殘差標準差的估計
- .cooksd
-
庫克距離,
cooks.distance() - .fitted
-
模型的擬合值
- .resid
-
殘差
- .stdresid
-
標準化殘差
例子
mod <- lm(mpg ~ wt, data = mtcars)
head(fortify(mod))
#> mpg wt .hat .sigma .cooksd .fitted
#> Mazda RX4 21.0 2.620 0.04326896 3.067494 1.327407e-02 23.28261
#> Mazda RX4 Wag 21.0 2.875 0.03519677 3.093068 1.723963e-03 21.91977
#> Datsun 710 22.8 2.320 0.05837573 3.072127 1.543937e-02 24.88595
#> Hornet 4 Drive 21.4 3.215 0.03125017 3.088268 3.020558e-03 20.10265
#> Hornet Sportabout 18.7 3.440 0.03292182 3.097722 7.599578e-05 18.90014
#> Valiant 18.1 3.460 0.03323551 3.095184 9.210650e-04 18.79325
#> .resid .stdresid
#> Mazda RX4 -2.2826106 -0.76616765
#> Mazda RX4 Wag -0.9197704 -0.30743051
#> Datsun 710 -2.0859521 -0.70575249
#> Hornet 4 Drive 1.2973499 0.43275114
#> Hornet Sportabout -0.2001440 -0.06681879
#> Valiant -0.6932545 -0.23148309
head(fortify(mod, mtcars))
#> mpg cyl disp hp drat wt qsec vs am gear carb
#> Mazda RX4 21.0 6 160 110 3.90 2.620 16.46 0 1 4 4
#> Mazda RX4 Wag 21.0 6 160 110 3.90 2.875 17.02 0 1 4 4
#> Datsun 710 22.8 4 108 93 3.85 2.320 18.61 1 1 4 1
#> Hornet 4 Drive 21.4 6 258 110 3.08 3.215 19.44 1 0 3 1
#> Hornet Sportabout 18.7 8 360 175 3.15 3.440 17.02 0 0 3 2
#> Valiant 18.1 6 225 105 2.76 3.460 20.22 1 0 3 1
#> .hat .sigma .cooksd .fitted .resid
#> Mazda RX4 0.04326896 3.067494 1.327407e-02 23.28261 -2.2826106
#> Mazda RX4 Wag 0.03519677 3.093068 1.723963e-03 21.91977 -0.9197704
#> Datsun 710 0.05837573 3.072127 1.543937e-02 24.88595 -2.0859521
#> Hornet 4 Drive 0.03125017 3.088268 3.020558e-03 20.10265 1.2973499
#> Hornet Sportabout 0.03292182 3.097722 7.599578e-05 18.90014 -0.2001440
#> Valiant 0.03323551 3.095184 9.210650e-04 18.79325 -0.6932545
#> .stdresid
#> Mazda RX4 -0.76616765
#> Mazda RX4 Wag -0.30743051
#> Datsun 710 -0.70575249
#> Hornet 4 Drive 0.43275114
#> Hornet Sportabout -0.06681879
#> Valiant -0.23148309
plot(mod, which = 1)
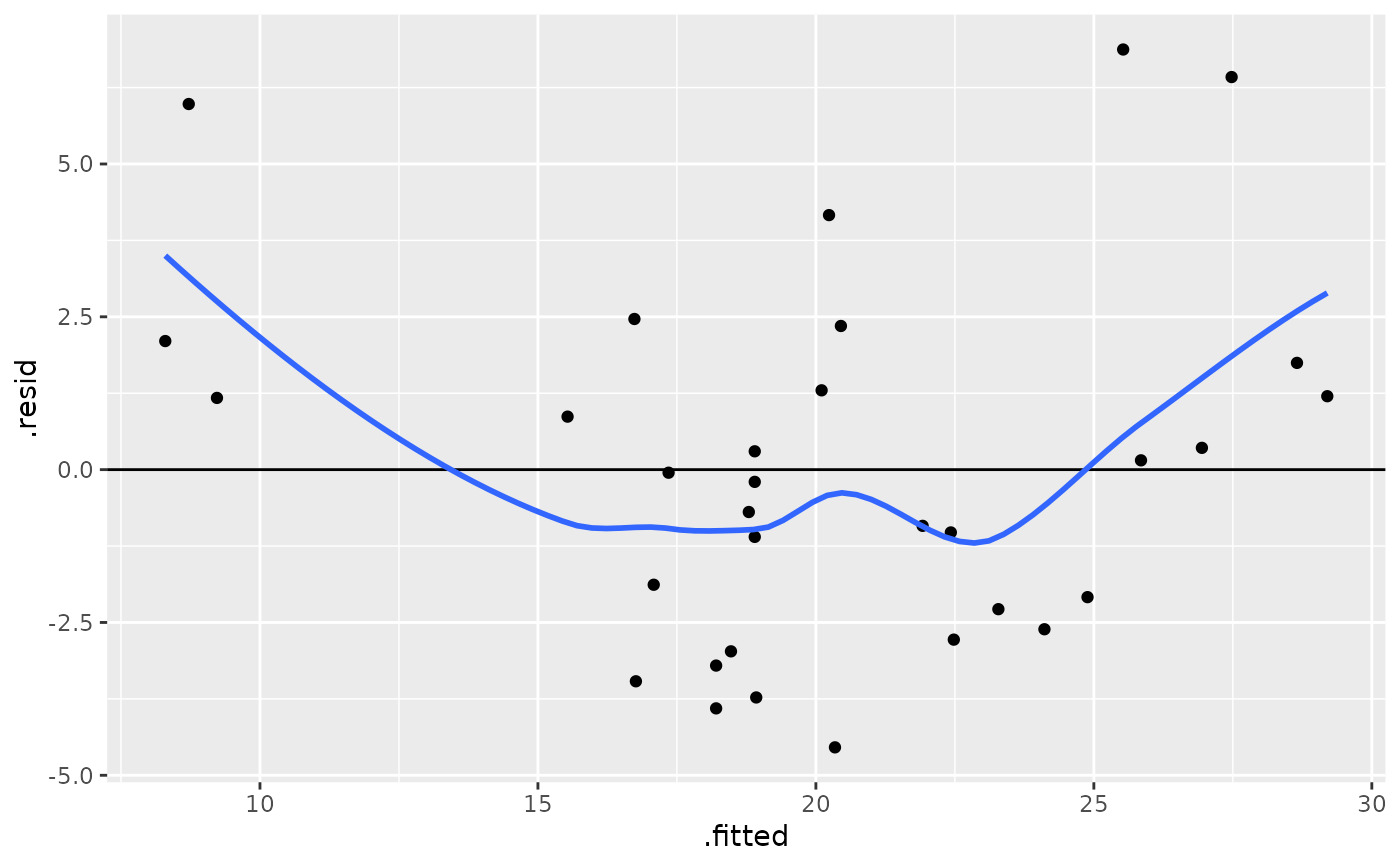
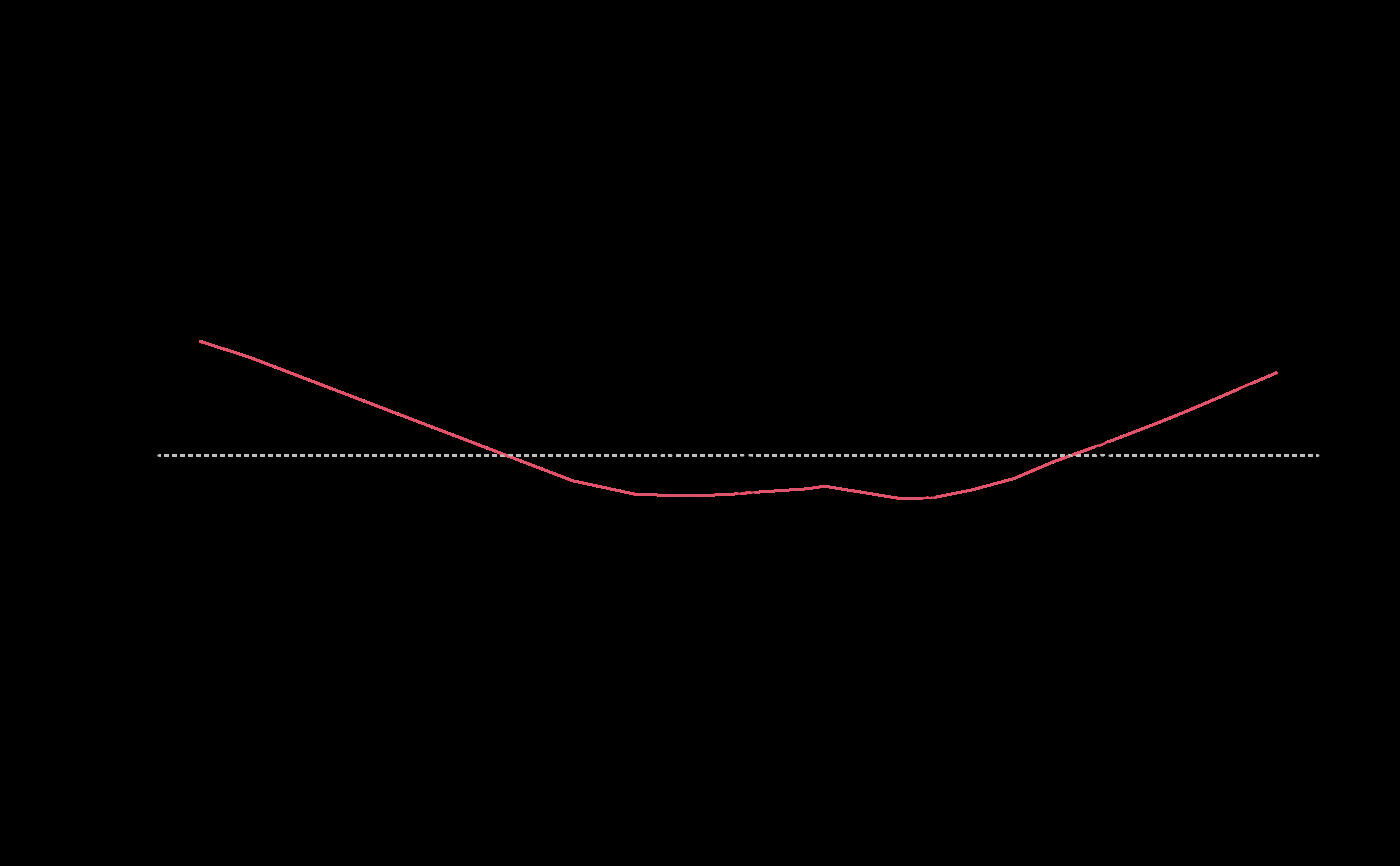 ggplot(mod, aes(.fitted, .resid)) +
geom_point() +
geom_hline(yintercept = 0) +
geom_smooth(se = FALSE)
#> `geom_smooth()` using method = 'loess' and formula = 'y ~ x'
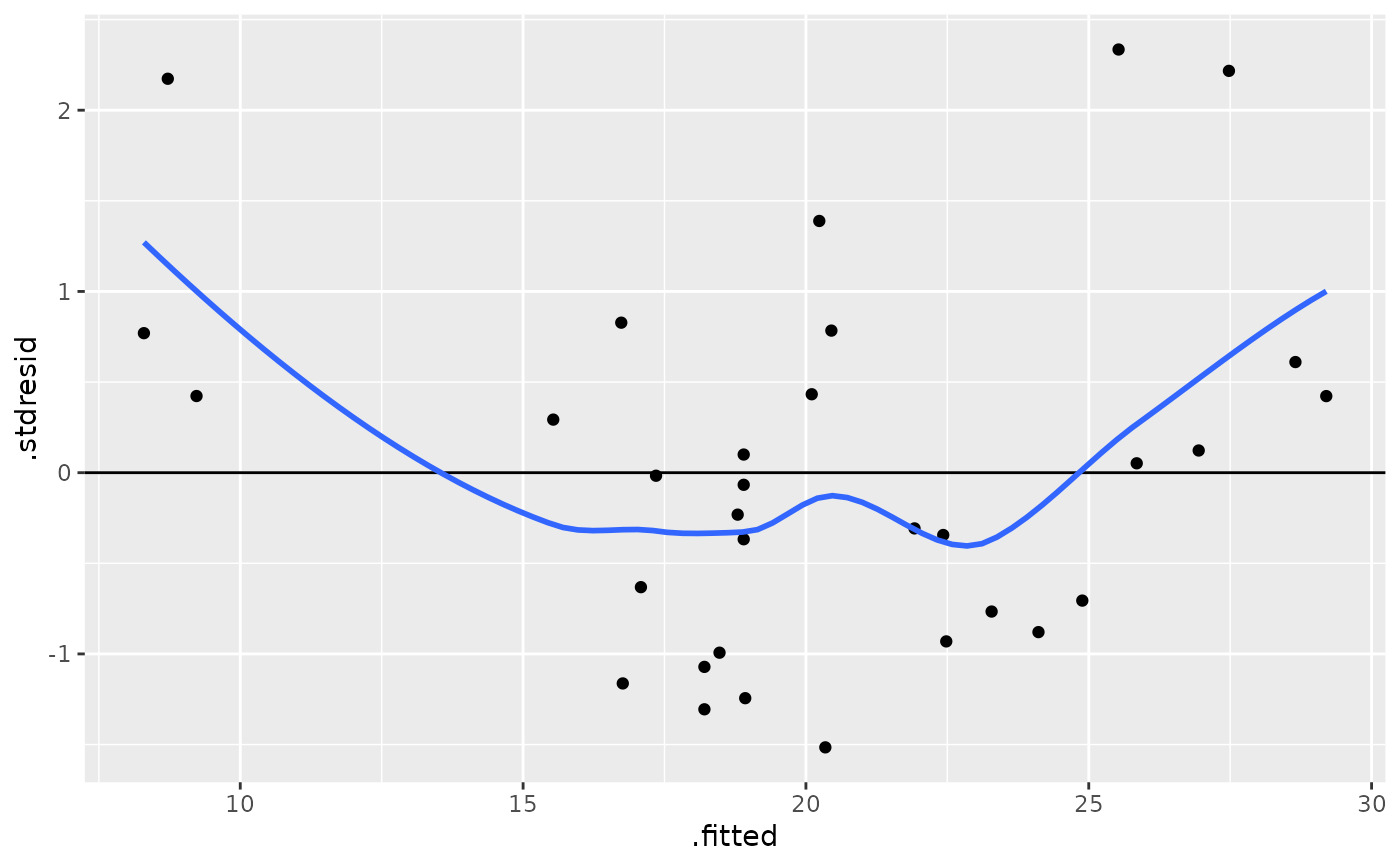
 ggplot(mod, aes(.fitted, .stdresid)) +
geom_point() +
geom_hline(yintercept = 0) +
geom_smooth(se = FALSE)
#> `geom_smooth()` using method = 'loess' and formula = 'y ~ x'
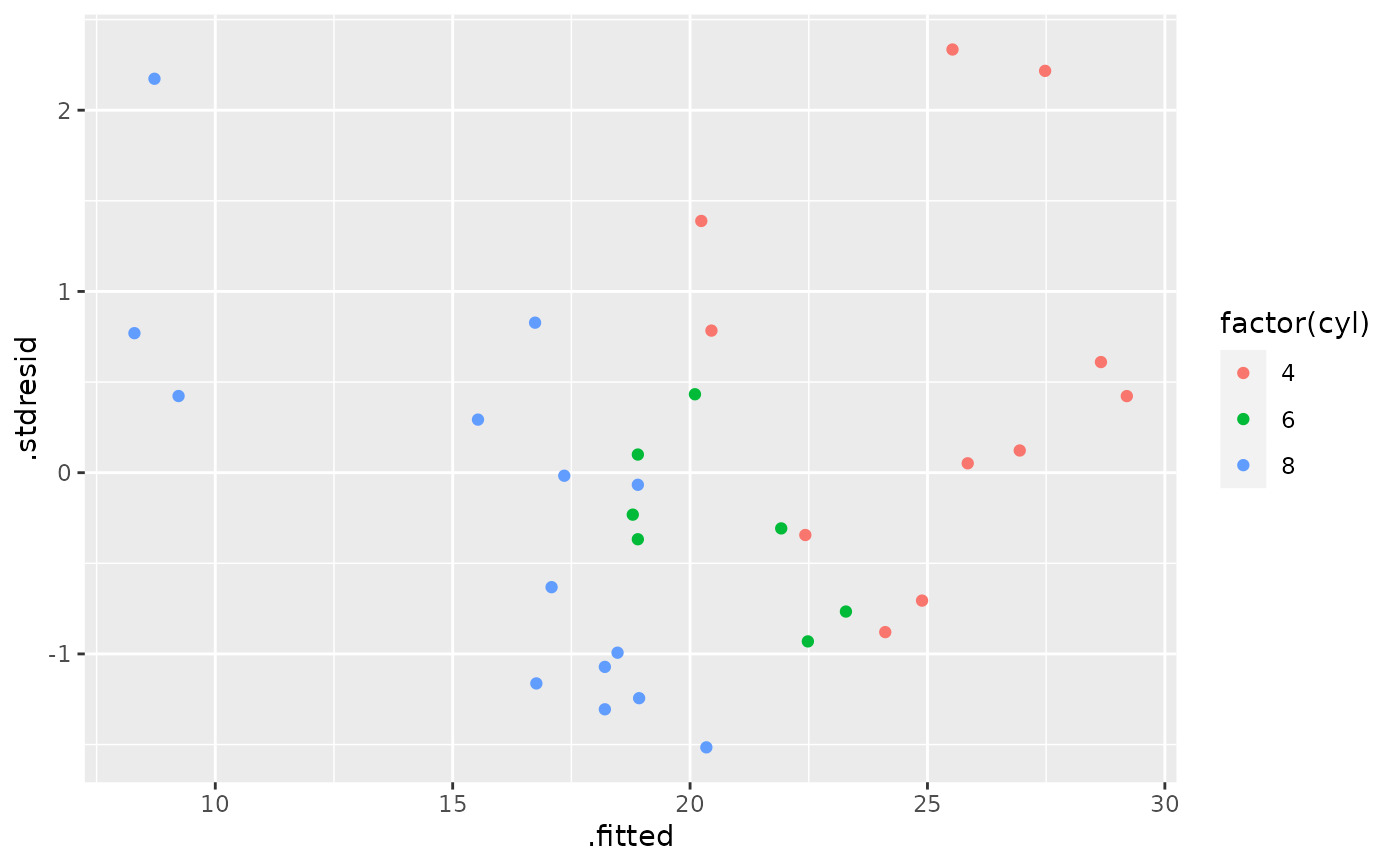
 ggplot(fortify(mod, mtcars), aes(.fitted, .stdresid)) +
geom_point(aes(colour = factor(cyl)))
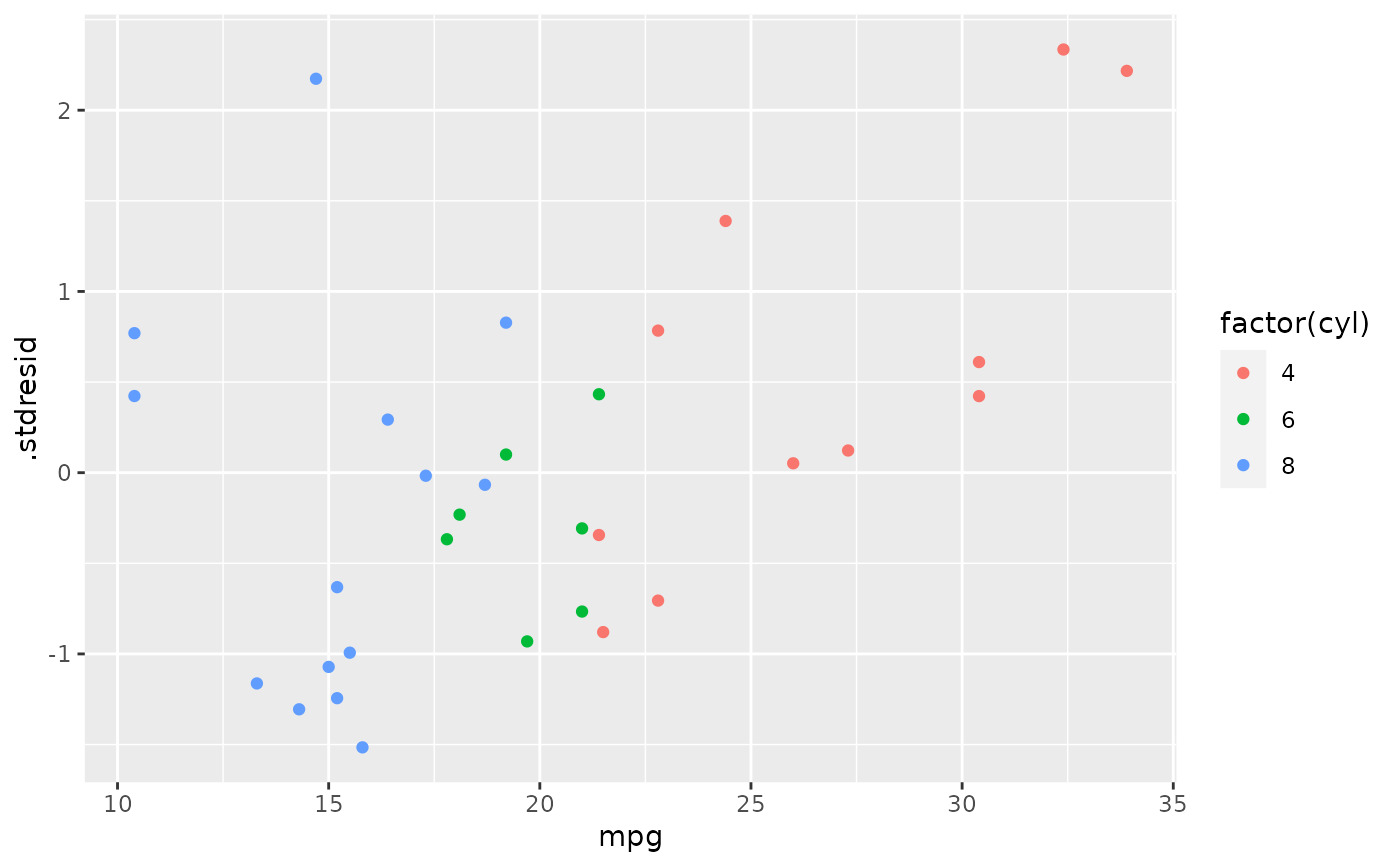
 ggplot(fortify(mod, mtcars), aes(mpg, .stdresid)) +
geom_point(aes(colour = factor(cyl)))
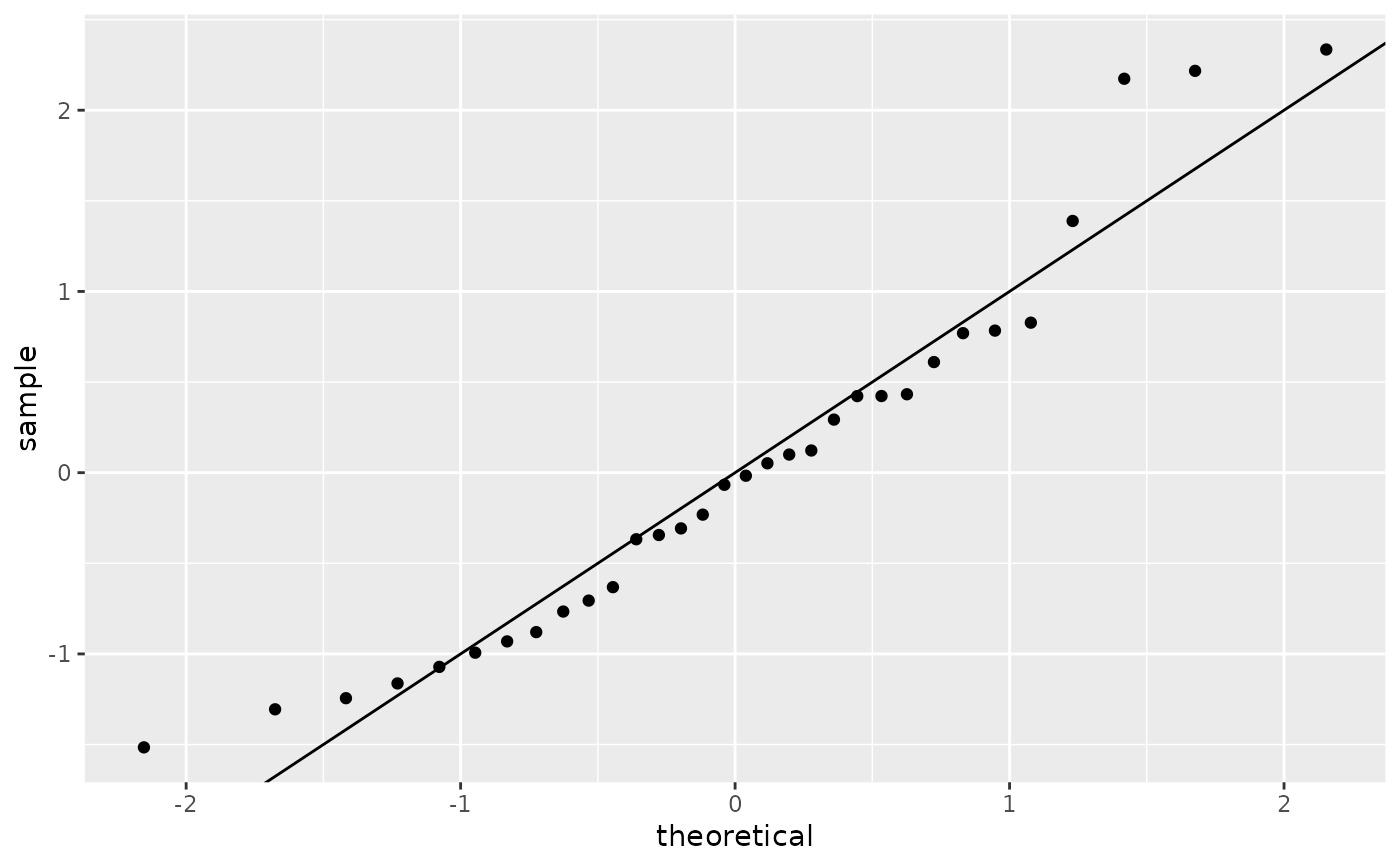
 plot(mod, which = 2)
 ggplot(mod) +
stat_qq(aes(sample = .stdresid)) +
geom_abline()
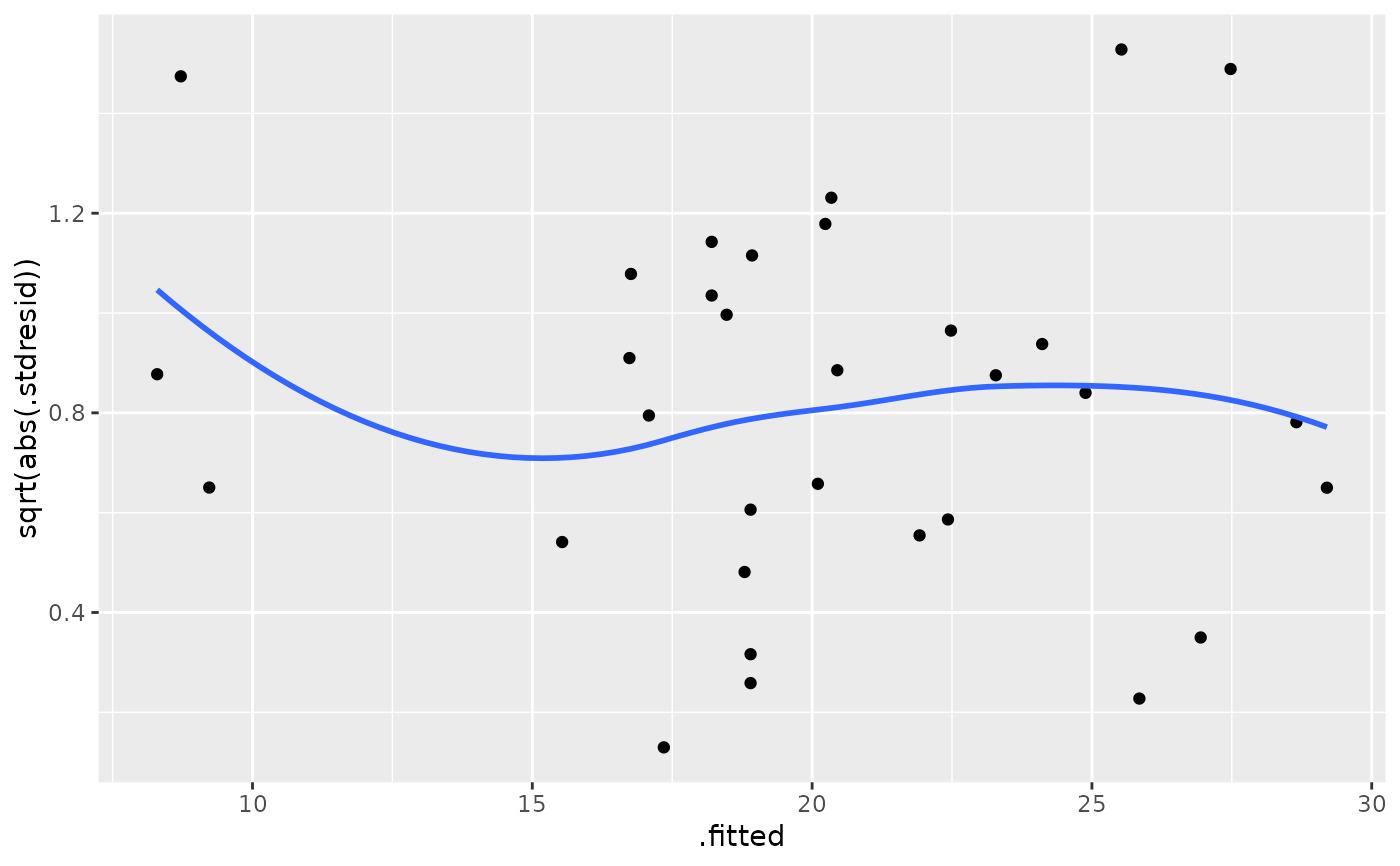
 plot(mod, which = 3)
 ggplot(mod, aes(.fitted, sqrt(abs(.stdresid)))) +
geom_point() +
geom_smooth(se = FALSE)
#> `geom_smooth()` using method = 'loess' and formula = 'y ~ x'
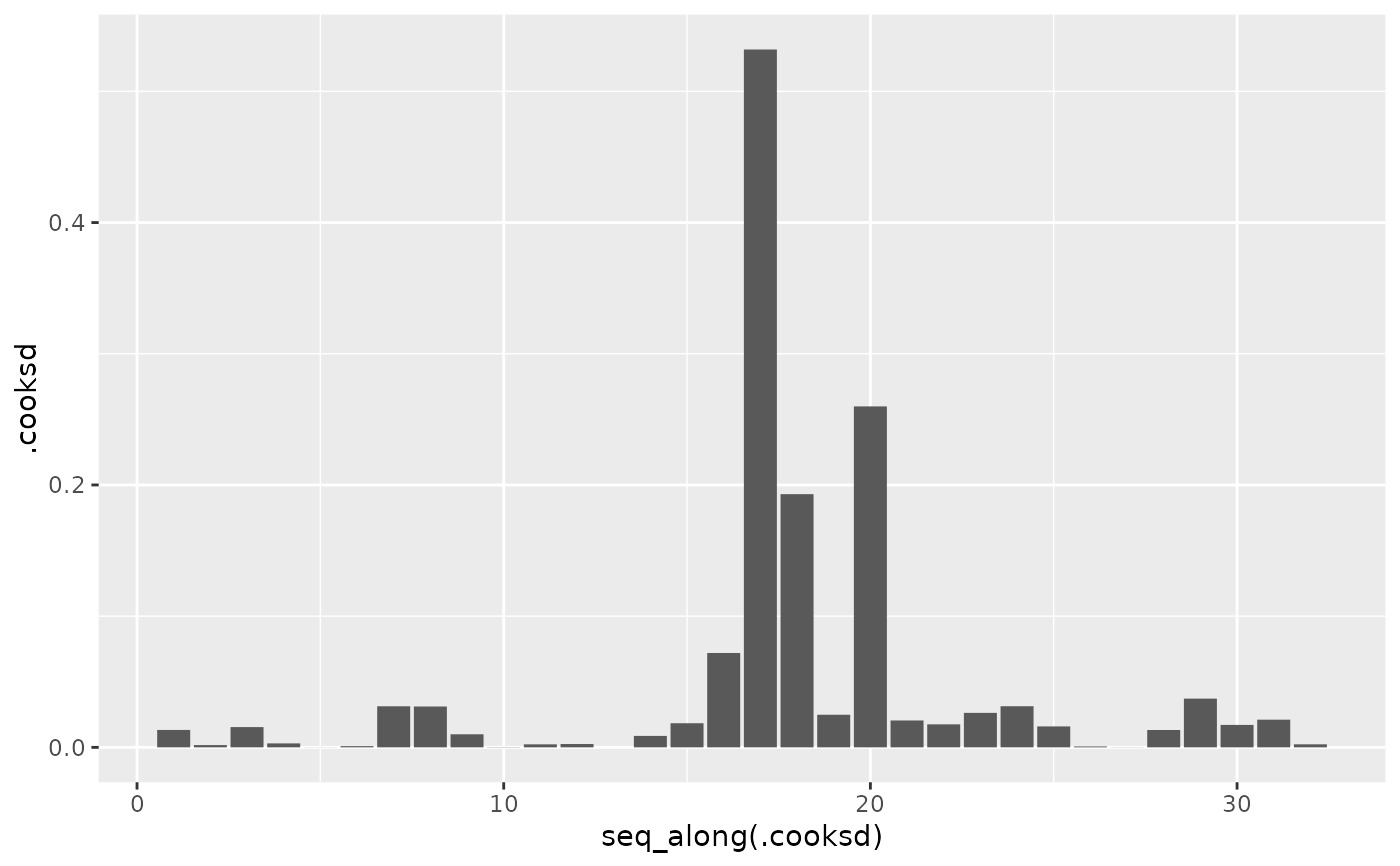
 plot(mod, which = 4)
 ggplot(mod, aes(seq_along(.cooksd), .cooksd)) +
geom_col()
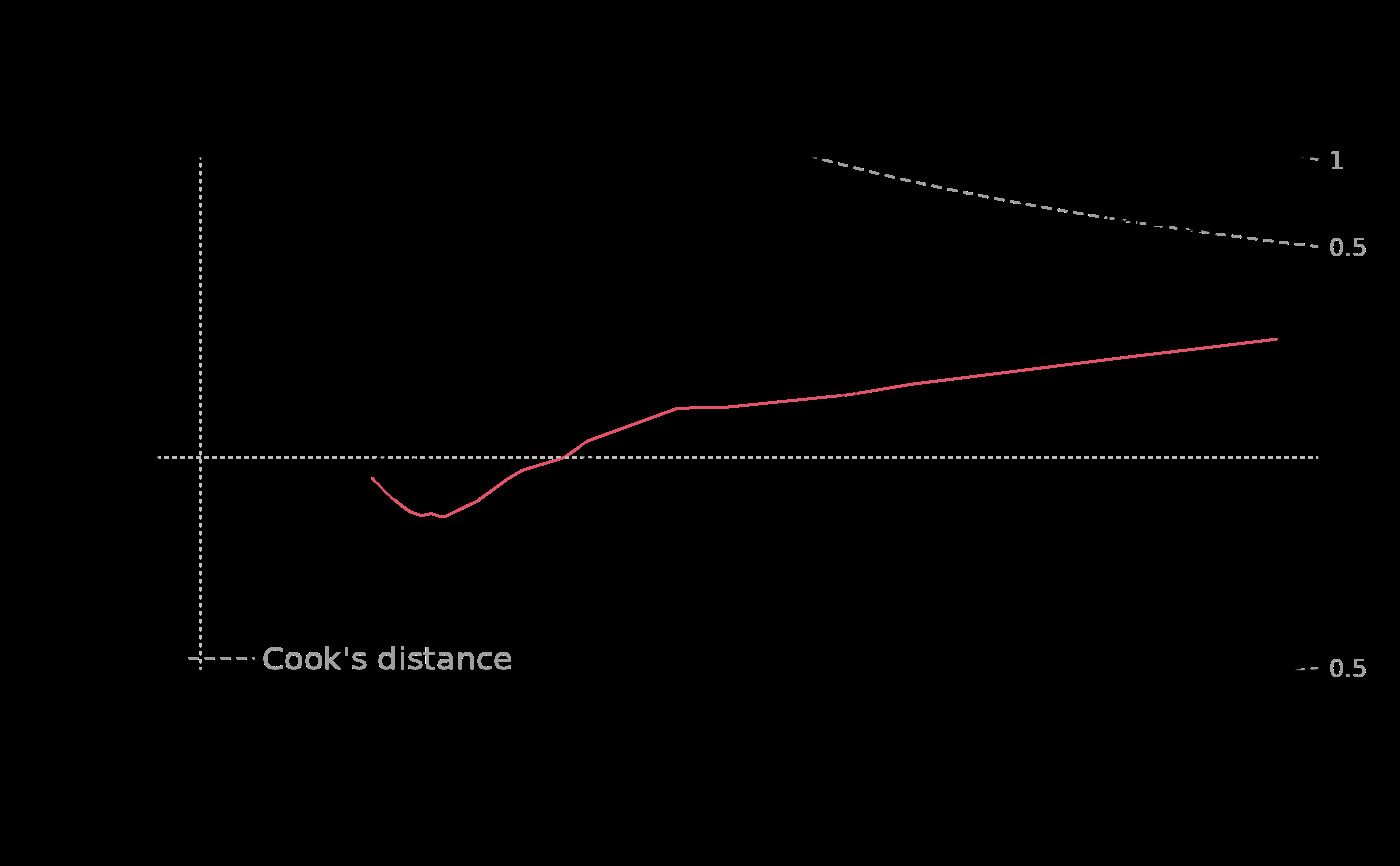
 plot(mod, which = 5)
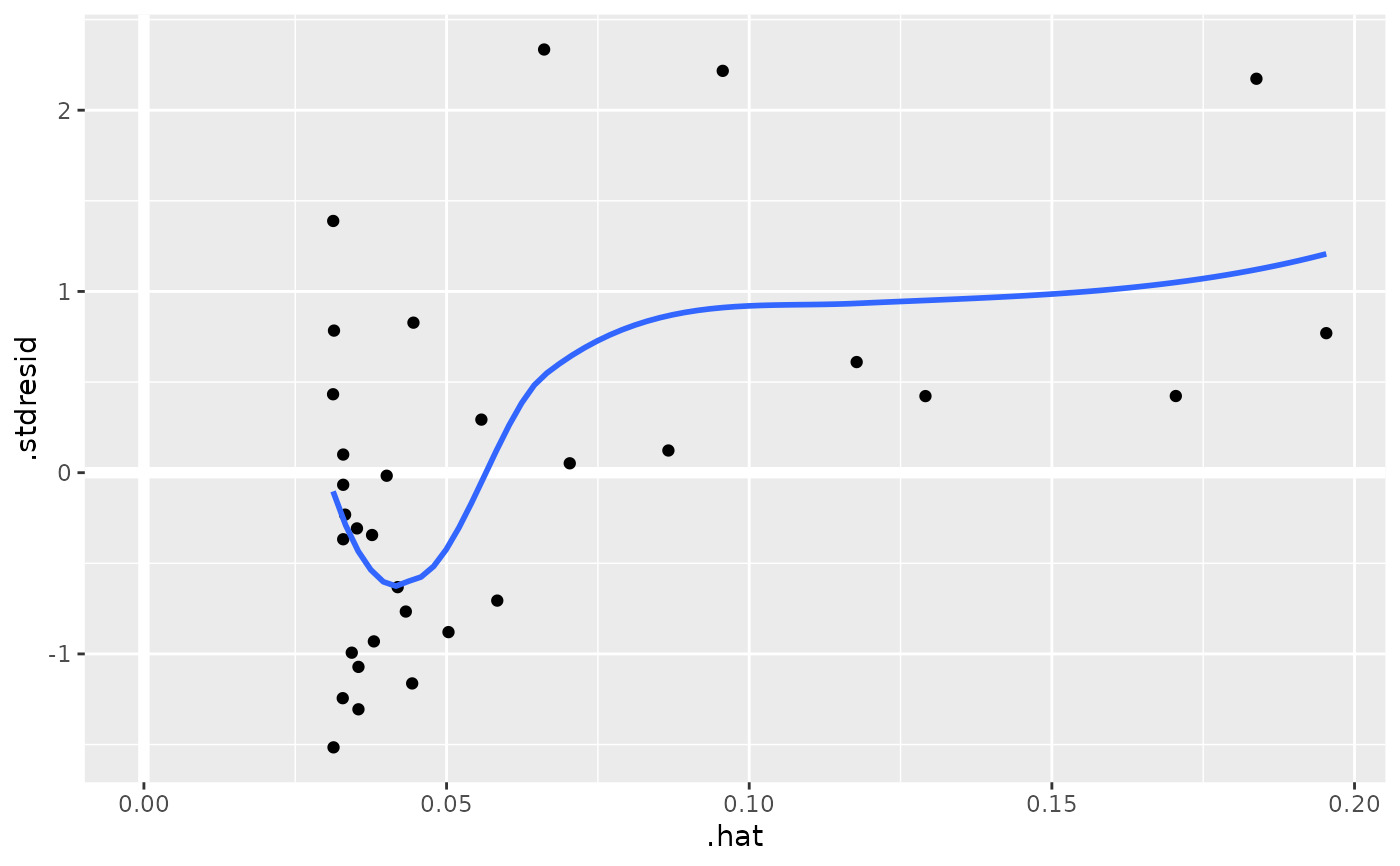
 ggplot(mod, aes(.hat, .stdresid)) +
geom_vline(linewidth = 2, colour = "white", xintercept = 0) +
geom_hline(linewidth = 2, colour = "white", yintercept = 0) +
geom_point() + geom_smooth(se = FALSE)
#> `geom_smooth()` using method = 'loess' and formula = 'y ~ x'
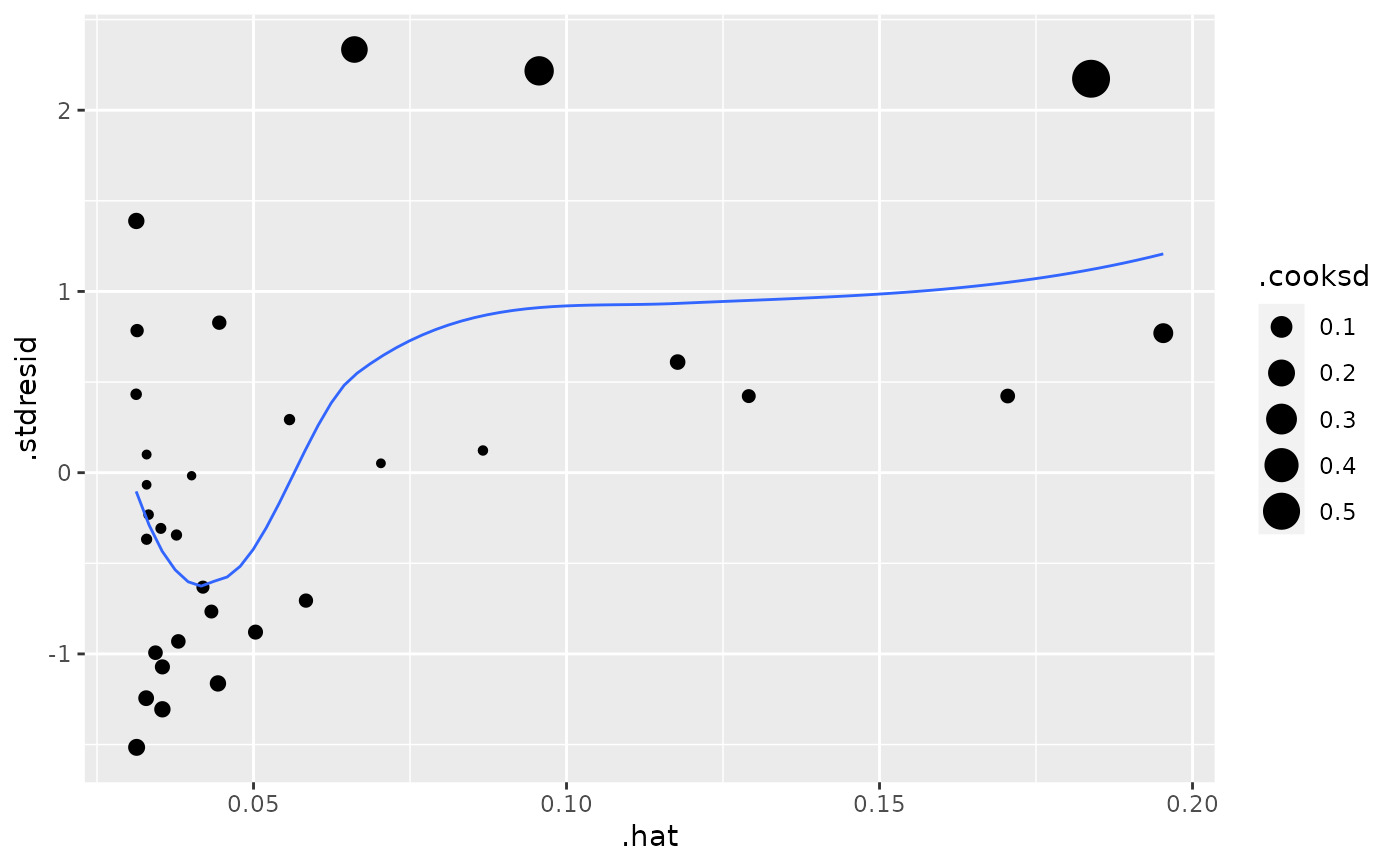
 ggplot(mod, aes(.hat, .stdresid)) +
geom_point(aes(size = .cooksd)) +
geom_smooth(se = FALSE, linewidth = 0.5)
#> `geom_smooth()` using method = 'loess' and formula = 'y ~ x'
 plot(mod, which = 6)
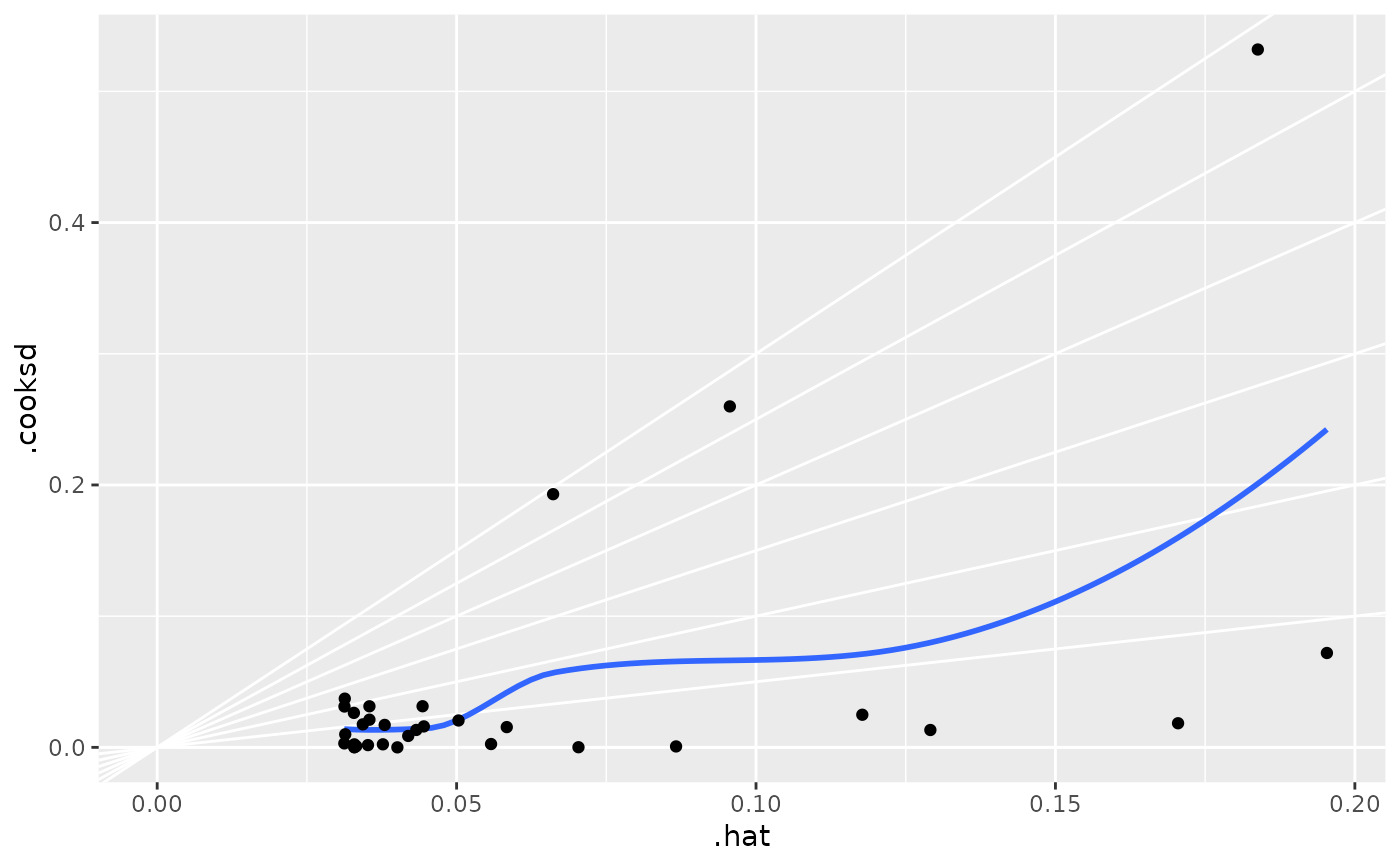
 ggplot(mod, aes(.hat, .cooksd)) +
geom_vline(xintercept = 0, colour = NA) +
geom_abline(slope = seq(0, 3, by = 0.5), colour = "white") +
geom_smooth(se = FALSE) +
geom_point()
#> `geom_smooth()` using method = 'loess' and formula = 'y ~ x'
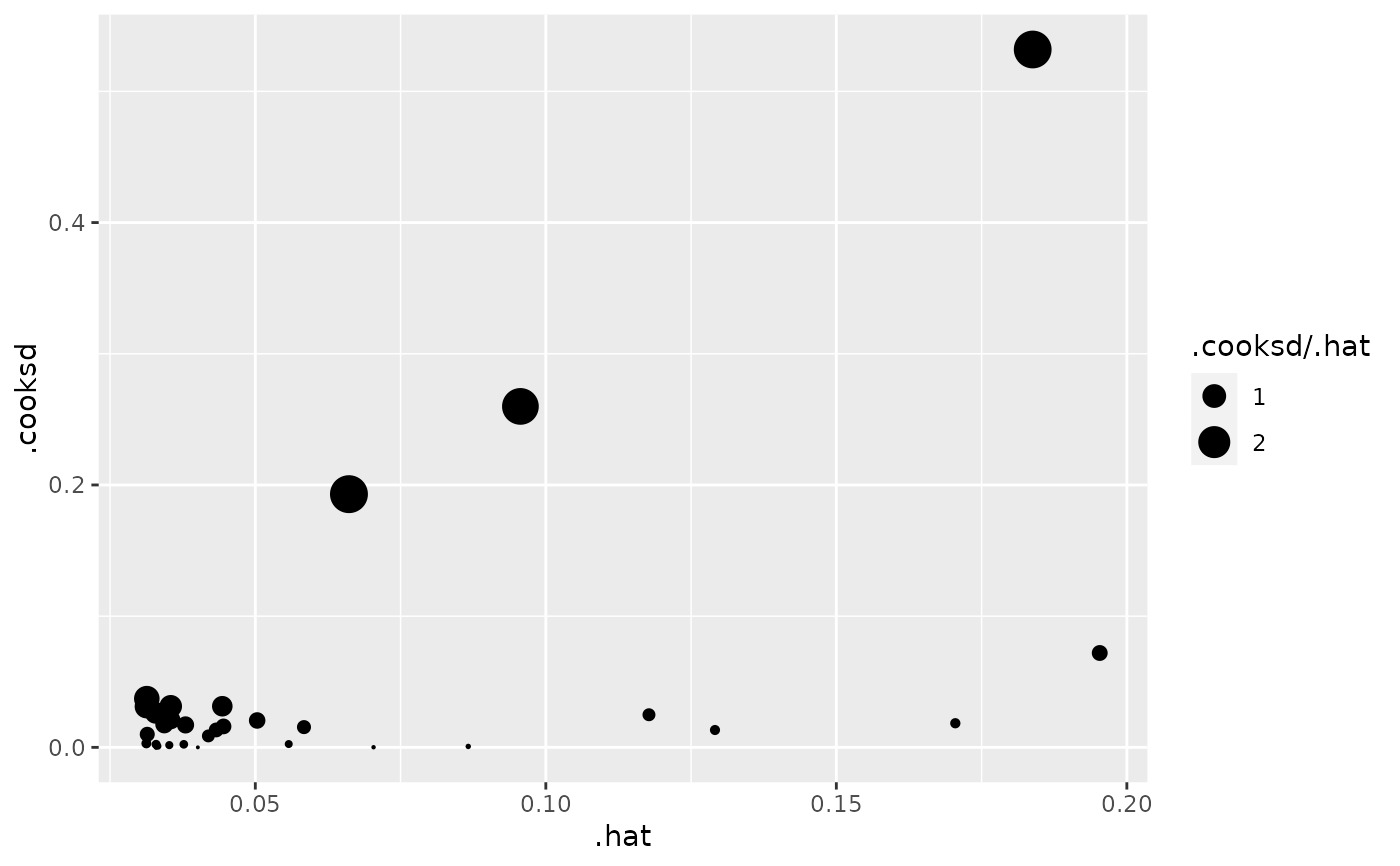
 ggplot(mod, aes(.hat, .cooksd)) +
geom_point(aes(size = .cooksd / .hat)) +
scale_size_area()
相關用法
- R ggplot2 facet_wrap 將 1d 麵板帶包成 2d 麵板
- R ggplot2 facet_grid 將麵板布置在網格中
- R ggplot2 annotation_logticks 注釋:記錄刻度線
- R ggplot2 vars 引用分麵變量
- R ggplot2 position_stack 將重疊的對象堆疊在一起
- R ggplot2 geom_qq 分位數-分位數圖
- R ggplot2 geom_spoke 由位置、方向和距離參數化的線段
- R ggplot2 geom_quantile 分位數回歸
- R ggplot2 geom_text 文本
- R ggplot2 get_alt_text 從繪圖中提取替代文本
- R ggplot2 annotation_custom 注釋:自定義grob
- R ggplot2 geom_ribbon 函數區和麵積圖
- R ggplot2 stat_ellipse 計算法行數據橢圓
- R ggplot2 resolution 計算數值向量的“分辨率”
- R ggplot2 geom_boxplot 盒須圖(Tukey 風格)
- R ggplot2 lims 設置規模限製
- R ggplot2 geom_hex 二維箱計數的六邊形熱圖
- R ggplot2 scale_gradient 漸變色階
- R ggplot2 scale_shape 形狀比例,又稱字形
- R ggplot2 geom_bar 條形圖
- R ggplot2 draw_key 圖例的關鍵字形
- R ggplot2 annotate 創建注釋層
- R ggplot2 label_bquote 帶有數學表達式的標簽
- R ggplot2 annotation_map 注釋:Map
- R ggplot2 scale_viridis 來自 viridisLite 的 Viridis 色標
注:本文由純淨天空篩選整理自Hadley Wickham等大神的英文原創作品 Supplement the data fitted to a linear model with model fit statistics.。非經特殊聲明,原始代碼版權歸原作者所有,本譯文未經允許或授權,請勿轉載或複製。
