極坐標係最常用於餅圖,餅圖是極坐標中的堆疊條形圖。
參數
- theta
-
將角度映射到的變量(
x或y) - start
-
起點距 12 點鍾的弧度偏移量。根據
direction的值順時針或逆時針應用偏移。 - direction
-
1、順時針; -1,逆時針
- clip
-
是否應該將繪圖裁剪到繪圖麵板的範圍內?設置
"on"(默認)表示是,設置"off"表示否。詳情請參見coord_cartesian()。
例子
# NOTE: Use these plots with caution - polar coordinates has
# major perceptual problems. The main point of these examples is
# to demonstrate how these common plots can be described in the
# grammar. Use with EXTREME caution.
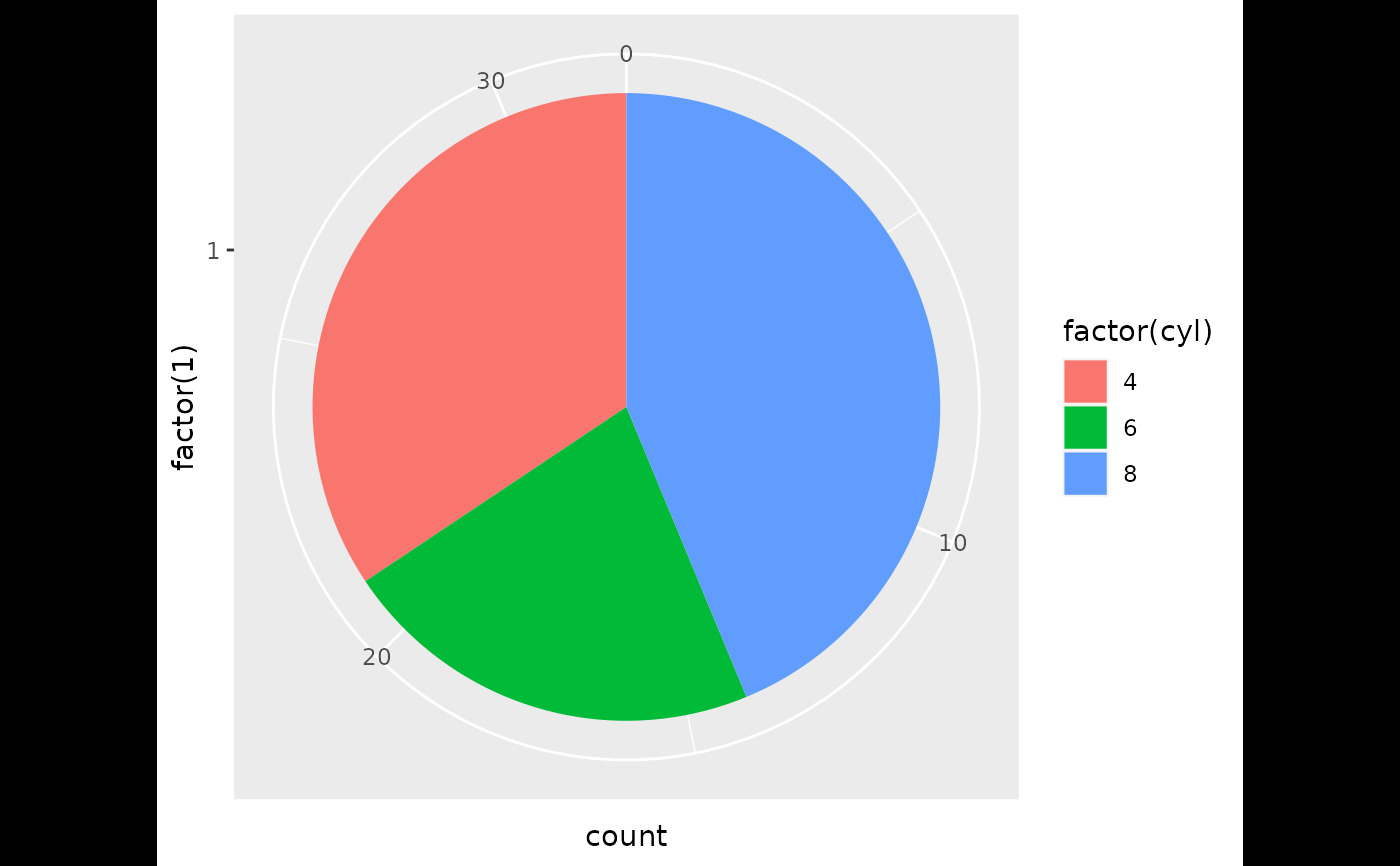
#' # A pie chart = stacked bar chart + polar coordinates
pie <- ggplot(mtcars, aes(x = factor(1), fill = factor(cyl))) +
geom_bar(width = 1)
pie + coord_polar(theta = "y")
 # \donttest{
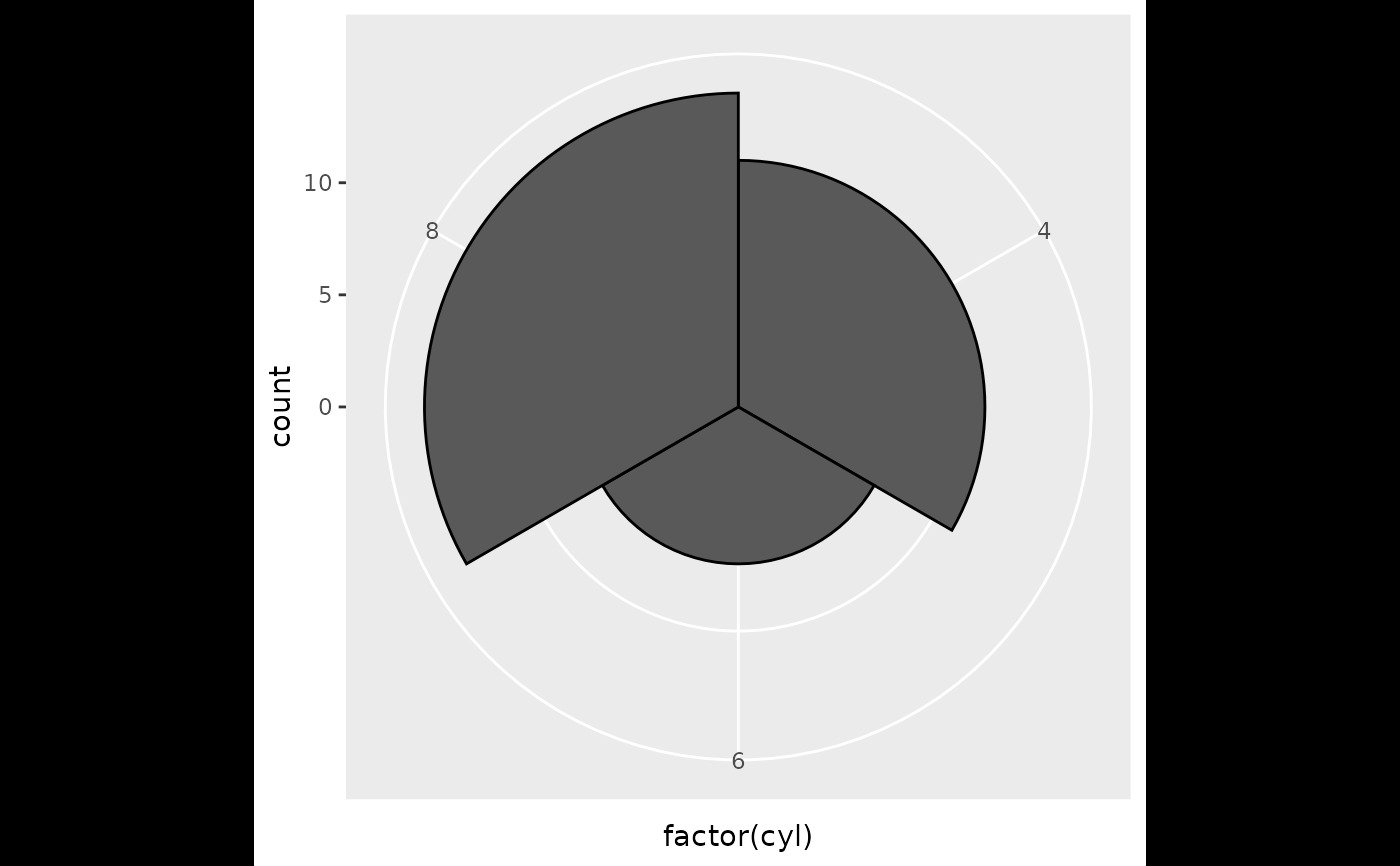
# A coxcomb plot = bar chart + polar coordinates
cxc <- ggplot(mtcars, aes(x = factor(cyl))) +
geom_bar(width = 1, colour = "black")
cxc + coord_polar()
# \donttest{
# A coxcomb plot = bar chart + polar coordinates
cxc <- ggplot(mtcars, aes(x = factor(cyl))) +
geom_bar(width = 1, colour = "black")
cxc + coord_polar()
 # A new type of plot?
cxc + coord_polar(theta = "y")
# A new type of plot?
cxc + coord_polar(theta = "y")
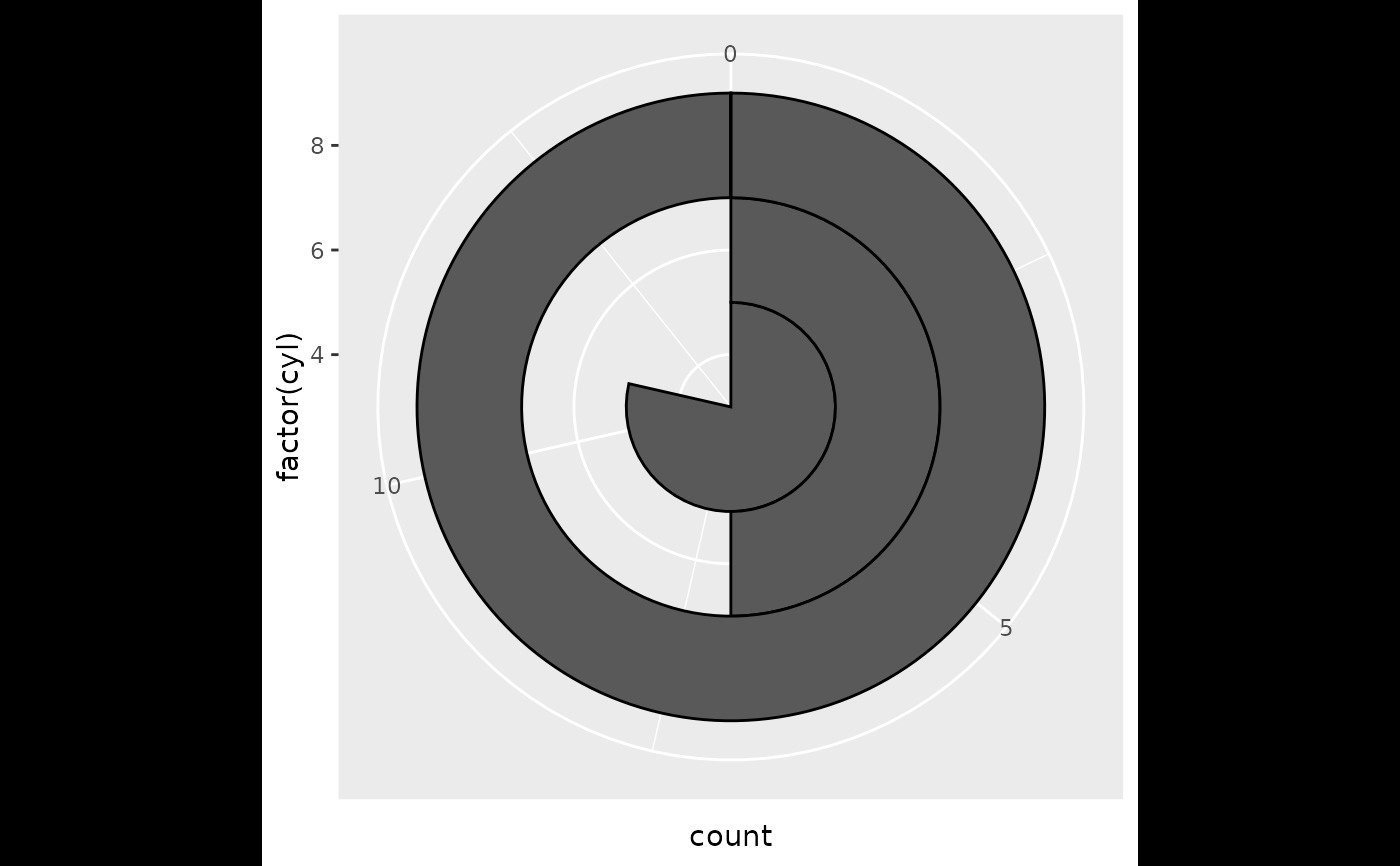 # The bullseye chart
pie + coord_polar()
# The bullseye chart
pie + coord_polar()
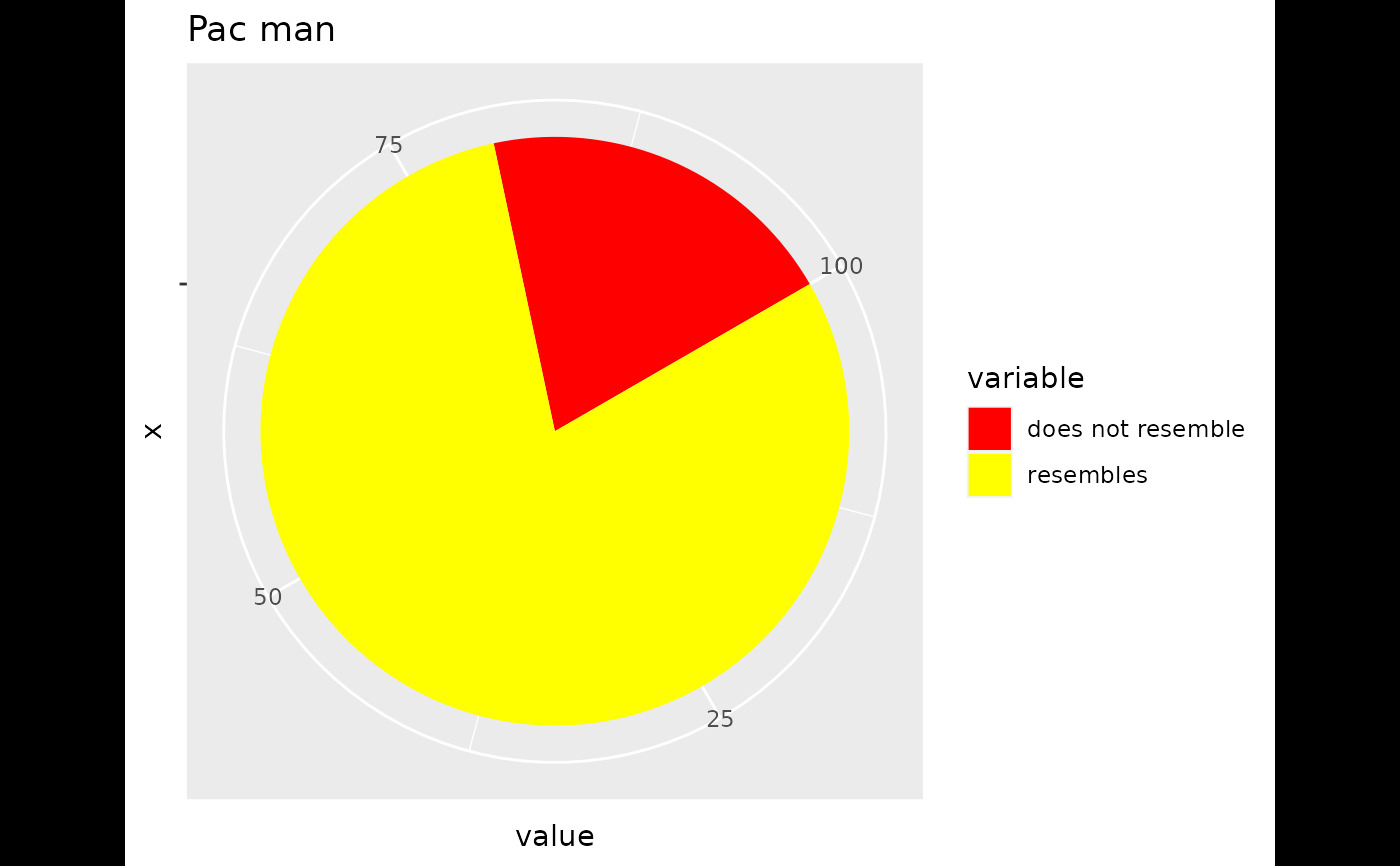
 # Hadley's favourite pie chart
df <- data.frame(
variable = c("does not resemble", "resembles"),
value = c(20, 80)
)
ggplot(df, aes(x = "", y = value, fill = variable)) +
geom_col(width = 1) +
scale_fill_manual(values = c("red", "yellow")) +
coord_polar("y", start = pi / 3) +
labs(title = "Pac man")
# Hadley's favourite pie chart
df <- data.frame(
variable = c("does not resemble", "resembles"),
value = c(20, 80)
)
ggplot(df, aes(x = "", y = value, fill = variable)) +
geom_col(width = 1) +
scale_fill_manual(values = c("red", "yellow")) +
coord_polar("y", start = pi / 3) +
labs(title = "Pac man")
 # Windrose + doughnut plot
if (require("ggplot2movies")) {
movies$rrating <- cut_interval(movies$rating, length = 1)
movies$budgetq <- cut_number(movies$budget, 4)
doh <- ggplot(movies, aes(x = rrating, fill = budgetq))
# Wind rose
doh + geom_bar(width = 1) + coord_polar()
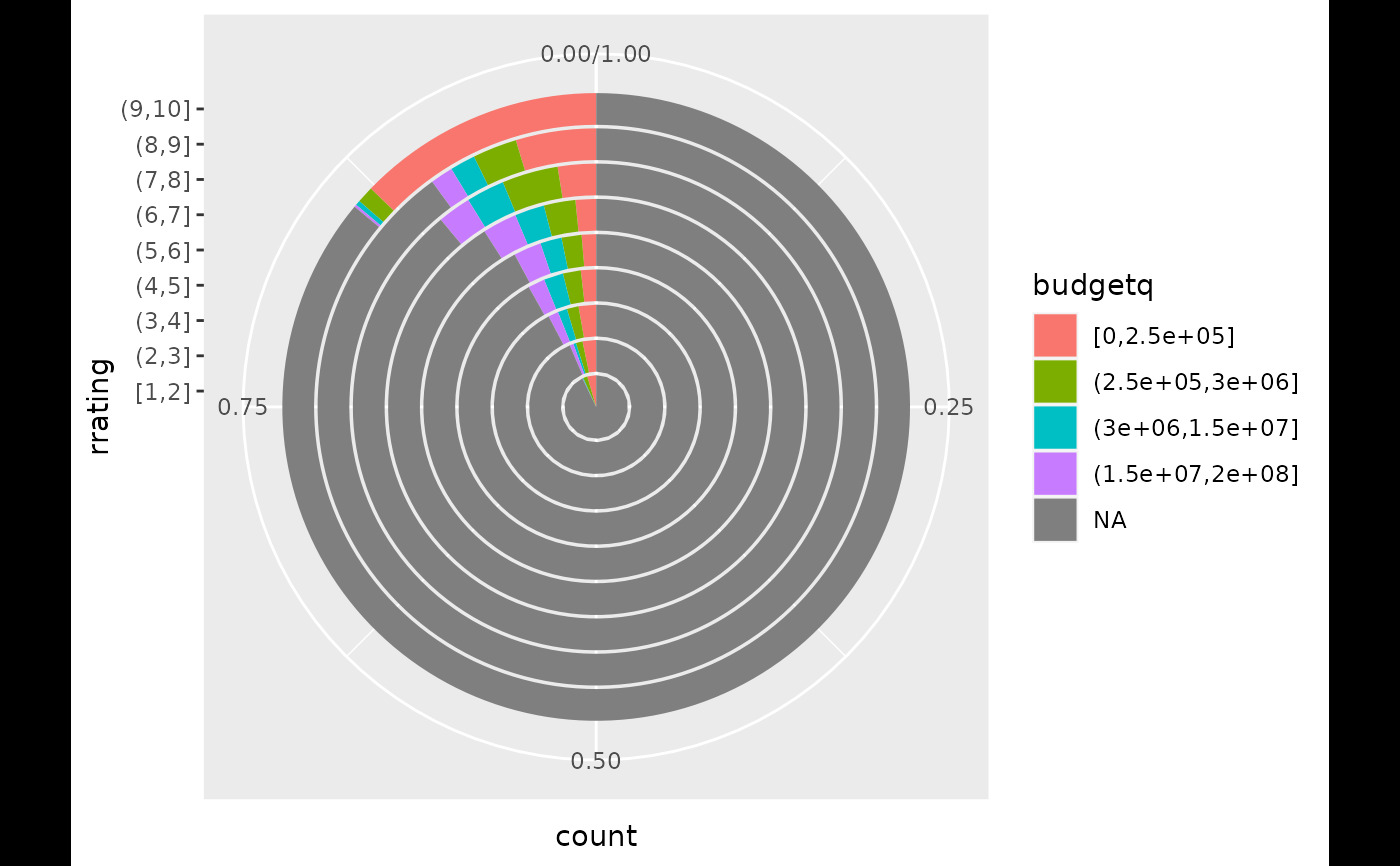
# Race track plot
doh + geom_bar(width = 0.9, position = "fill") + coord_polar(theta = "y")
}
#> Loading required package: ggplot2movies
# Windrose + doughnut plot
if (require("ggplot2movies")) {
movies$rrating <- cut_interval(movies$rating, length = 1)
movies$budgetq <- cut_number(movies$budget, 4)
doh <- ggplot(movies, aes(x = rrating, fill = budgetq))
# Wind rose
doh + geom_bar(width = 1) + coord_polar()
# Race track plot
doh + geom_bar(width = 0.9, position = "fill") + coord_polar(theta = "y")
}
#> Loading required package: ggplot2movies
 # }
# }
相關用法
- R ggplot2 coord_fixed 具有固定“縱橫比”的笛卡爾坐標
- R ggplot2 coord_map Map投影
- R ggplot2 coord_cartesian 笛卡爾坐標
- R ggplot2 coord_trans 變換後的笛卡爾坐標係
- R ggplot2 coord_flip x 和 y 翻轉的笛卡爾坐標
- R ggplot2 cut_interval 將數值數據離散化為分類數據
- R ggplot2 annotation_logticks 注釋:記錄刻度線
- R ggplot2 vars 引用分麵變量
- R ggplot2 position_stack 將重疊的對象堆疊在一起
- R ggplot2 geom_qq 分位數-分位數圖
- R ggplot2 geom_spoke 由位置、方向和距離參數化的線段
- R ggplot2 geom_quantile 分位數回歸
- R ggplot2 geom_text 文本
- R ggplot2 get_alt_text 從繪圖中提取替代文本
- R ggplot2 annotation_custom 注釋:自定義grob
- R ggplot2 geom_ribbon 函數區和麵積圖
- R ggplot2 stat_ellipse 計算法行數據橢圓
- R ggplot2 resolution 計算數值向量的“分辨率”
- R ggplot2 geom_boxplot 盒須圖(Tukey 風格)
- R ggplot2 lims 設置規模限製
- R ggplot2 geom_hex 二維箱計數的六邊形熱圖
- R ggplot2 scale_gradient 漸變色階
- R ggplot2 scale_shape 形狀比例,又稱字形
- R ggplot2 geom_bar 條形圖
- R ggplot2 draw_key 圖例的關鍵字形
注:本文由純淨天空篩選整理自Hadley Wickham等大神的英文原創作品 Polar coordinates。非經特殊聲明,原始代碼版權歸原作者所有,本譯文未經允許或授權,請勿轉載或複製。