本文简要介绍 python 语言中 scipy.signal.minimum_phase 的用法。
用法:
scipy.signal.minimum_phase(h, method='homomorphic', n_fft=None)#将linear-phase FIR 滤波器转换为最小相位
- h: 数组
Linear-phase FIR 滤波器系数。
- method: {‘hilbert’, ‘homomorphic’}
使用方法:
- ‘homomorphic’ (default)
This method [4] [5] works best with filters with an odd number of taps, and the resulting minimum phase filter will have a magnitude response that approximates the square root of the original filter’s magnitude response.
- ‘hilbert’
This method [1] is designed to be used with equiripple filters (e.g., from
remez) with unity or zero gain regions.
- n_fft: int
用于 FFT 的点数。应该至少比信号长度大几倍(见注释)。
- h_minimum: 数组
过滤器的 minimum-phase 版本,长度为
(length(h) + 1) // 2。
参数 ::
返回 ::
注意:
Hilbert [1] 或同态 [4] [5] 方法都需要选择 FFT 长度来估计滤波器的复倒谱。
在 Hilbert 方法的情况下,与理想频谱
epsilon的偏差与阻带零点的数量n_stop和 FFT 长度n_fft相关,如下所示:epsilon = 2. * n_stop / n_fft例如,对于 100 个阻带零点和 2048 的 FFT 长度,
epsilon = 0.0976。如果我们保守地假设阻带零点的数量比滤波器长度小一,我们可以将 FFT 长度取为满足epsilon=0.01的 2 的下一个幂:n_fft = 2 ** int(np.ceil(np.log2(2 * (len(h) - 1) / 0.01)))这为希尔伯特和同态方法提供了合理的结果,并给出了
n_fft=None时使用的值。存在用于创建 minimum-phase 滤波器的替代实现,包括零反转 [2] 和频谱分解 [3] [4]。有关更多信息,请参阅:
参考:
[1] (1,2)N. Damera-Venkata 和 BL Evans,“实数和复数最小相位数字 FIR 滤波器的优化设计”,声学、语音和信号处理,1999 年。论文集,1999 年 IEEE 国际会议,亚利桑那州凤凰城,1999 年,第1145-1148 卷 3。 DOI:10.1109/ICASSP.1999.756179
[2]X. Chen 和 T. W. Parks,“通过直接分解设计最优最小相位 FIR 滤波器”,信号处理,卷。 10,没有。 4,第 369-383 页,1986 年 6 月。
[3]T. Saramaki,“有限脉冲响应滤波器设计”,数字信号处理手册,第 4 章,纽约:Wiley-Interscience,1993 年。
[4] (1,2,3)J. S. Lim,信号处理高级主题。新泽西州恩格尔伍德悬崖:普伦蒂斯霍尔,1988 年。
[5] (1,2)A. V. Oppenheim、R. W. Schafer 和 J. R. Buck,“Discrete-Time 信号处理”,第 2 版。新泽西州上马鞍河:Prentice Hall,1999 年。
例子:
创建一个最佳的linear-phase 过滤器,然后将其转换为最小相位:
>>> import numpy as np
>>> from scipy.signal import remez, minimum_phase, freqz, group_delay
>>> import matplotlib.pyplot as plt
>>> freq = [0, 0.2, 0.3, 1.0]
>>> desired = [1, 0]
>>> h_linear = remez(151, freq, desired, fs=2.)
将其转换为最小相位:
>>> h_min_hom = minimum_phase(h_linear, method='homomorphic')
>>> h_min_hil = minimum_phase(h_linear, method='hilbert')
比较三个过滤器:
>>> fig, axs = plt.subplots(4, figsize=(4, 8))
>>> for h, style, color in zip((h_linear, h_min_hom, h_min_hil),
...                            ('-', '-', '--'), ('k', 'r', 'c')):
...     w, H = freqz(h)
...     w, gd = group_delay((h, 1))
...     w /= np.pi
...     axs[0].plot(h, color=color, linestyle=style)
...     axs[1].plot(w, np.abs(H), color=color, linestyle=style)
...     axs[2].plot(w, 20 * np.log10(np.abs(H)), color=color, linestyle=style)
...     axs[3].plot(w, gd, color=color, linestyle=style)
>>> for ax in axs:
...     ax.grid(True, color='0.5')
...     ax.fill_between(freq[1:3], *ax.get_ylim(), color='#ffeeaa', zorder=1)
>>> axs[0].set(xlim=[0, len(h_linear) - 1], ylabel='Amplitude', xlabel='Samples')
>>> axs[1].legend(['Linear', 'Min-Hom', 'Min-Hil'], title='Phase')
>>> for ax, ylim in zip(axs[1:], ([0, 1.1], [-150, 10], [-60, 60])):
...     ax.set(xlim=[0, 1], ylim=ylim, xlabel='Frequency')
>>> axs[1].set(ylabel='Magnitude')
>>> axs[2].set(ylabel='Magnitude (dB)')
>>> axs[3].set(ylabel='Group delay')
>>> plt.tight_layout()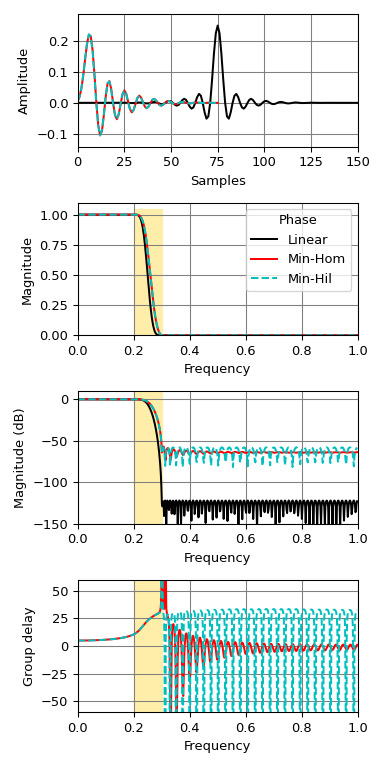
相关用法
- Python SciPy signal.max_len_seq用法及代码示例
- Python SciPy signal.morlet用法及代码示例
- Python SciPy signal.medfilt2d用法及代码示例
- Python SciPy signal.morlet2用法及代码示例
- Python SciPy signal.czt_points用法及代码示例
- Python SciPy signal.chirp用法及代码示例
- Python SciPy signal.residue用法及代码示例
- Python SciPy signal.iirdesign用法及代码示例
- Python SciPy signal.kaiser_atten用法及代码示例
- Python SciPy signal.oaconvolve用法及代码示例
- Python SciPy signal.hilbert用法及代码示例
- Python SciPy signal.ricker用法及代码示例
- Python SciPy signal.group_delay用法及代码示例
- Python SciPy signal.cheb2ord用法及代码示例
- Python SciPy signal.get_window用法及代码示例
- Python SciPy signal.lfilter用法及代码示例
- Python SciPy signal.coherence用法及代码示例
- Python SciPy signal.dfreqresp用法及代码示例
- Python SciPy signal.TransferFunction用法及代码示例
- Python SciPy signal.dbode用法及代码示例
- Python SciPy signal.residuez用法及代码示例
- Python SciPy signal.bilinear_zpk用法及代码示例
- Python SciPy signal.firls用法及代码示例
- Python SciPy signal.impulse用法及代码示例
- Python SciPy signal.buttord用法及代码示例
注:本文由纯净天空筛选整理自scipy.org大神的英文原创作品 scipy.signal.minimum_phase。非经特殊声明,原始代码版权归原作者所有,本译文未经允许或授权,请勿转载或复制。