本文简要介绍 python 语言中 scipy.interpolate.LSQBivariateSpline.ev 的用法。
用法:
LSQBivariateSpline.ev(xi, yi, dx=0, dy=0)#评估点处的样条线
返回
(xi[i], yi[i]), i=0,...,len(xi)-1处的插值。- xi, yi: array_like
输入坐标。遵循标准 Numpy 广播。轴的顺序与
np.meshgrid(..., indexing="ij")一致,与默认顺序np.meshgrid(..., indexing="xy")不一致。- dx: 整数,可选
x-derivative的订单
- dy: 整数,可选
y-derivative的订单
参数 ::
例子:
假设我们想要在二维上对一个指数衰减函数进行双线性插值。
>>> import numpy as np
>>> from scipy.interpolate import RectBivariateSpline
>>> def f(x, y):
...     return np.exp(-np.sqrt((x / 2) ** 2 + y**2))
我们在粗网格上对函数进行采样并设置插值器。请注意,网格网格的默认
indexing="xy"会在插值后导致意外(转置)结果。>>> xarr = np.linspace(-3, 3, 21) >>> yarr = np.linspace(-3, 3, 21) >>> xgrid, ygrid = np.meshgrid(xarr, yarr, indexing="ij") >>> zdata = f(xgrid, ygrid) >>> rbs = RectBivariateSpline(xarr, yarr, zdata, kx=1, ky=1)接下来,我们使用插值沿着更精细网格上的坐标空间的对角线切片对函数进行采样。
>>> xinterp = np.linspace(-3, 3, 201)
>>> yinterp = np.linspace(3, -3, 201)
>>> zinterp = rbs.ev(xinterp, yinterp)
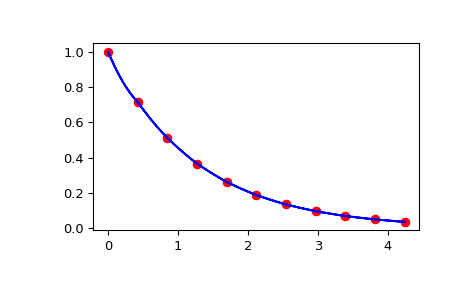
并检查插值是否作为沿着切片距原点的距离的函数通过函数评估。
>>> import matplotlib.pyplot as plt
>>> fig = plt.figure()
>>> ax1 = fig.add_subplot(1, 1, 1)
>>> ax1.plot(np.sqrt(xarr**2 + yarr**2), np.diag(zdata), "or")
>>> ax1.plot(np.sqrt(xinterp**2 + yinterp**2), zinterp, "-b")
>>> plt.show()
相关用法
- Python SciPy LSQBivariateSpline.__call__用法及代码示例
- Python SciPy LSQUnivariateSpline.antiderivative用法及代码示例
- Python SciPy LSQUnivariateSpline.integral用法及代码示例
- Python SciPy LSQUnivariateSpline.derivatives用法及代码示例
- Python SciPy LSQUnivariateSpline.get_residual用法及代码示例
- Python SciPy LSQUnivariateSpline.derivative用法及代码示例
- Python SciPy LSQUnivariateSpline.roots用法及代码示例
- Python SciPy LSQSphereBivariateSpline.__call__用法及代码示例
- Python SciPy LSQSphereBivariateSpline.ev用法及代码示例
- Python SciPy LinearConstraint.residual用法及代码示例
- Python SciPy LowLevelCallable用法及代码示例
- Python SciPy interpolate.make_interp_spline用法及代码示例
- Python SciPy stats.anderson用法及代码示例
- Python SciPy ClusterNode.pre_order用法及代码示例
- Python SciPy stats.iqr用法及代码示例
- Python SciPy FortranFile.read_record用法及代码示例
- Python SciPy ndimage.correlate用法及代码示例
- Python SciPy special.exp1用法及代码示例
- Python SciPy special.expn用法及代码示例
- Python SciPy signal.czt_points用法及代码示例
- Python SciPy interpolate.krogh_interpolate用法及代码示例
- Python SciPy ndimage.morphological_gradient用法及代码示例
- Python SciPy distance.sokalmichener用法及代码示例
- Python SciPy linalg.eigvalsh_tridiagonal用法及代码示例
- Python SciPy linalg.cdf2rdf用法及代码示例
注:本文由纯净天空筛选整理自scipy.org大神的英文原创作品 scipy.interpolate.LSQBivariateSpline.ev。非经特殊声明,原始代码版权归原作者所有,本译文未经允许或授权,请勿转载或复制。
