本文简要介绍 python 语言中 scipy.interpolate.make_interp_spline 的用法。
用法:
scipy.interpolate.make_interp_spline(x, y, k=3, t=None, bc_type=None, axis=0, check_finite=True)#计算插值 B-spline 的(系数)。
- x: 数组, 形状 (n,)
横坐标。
- y: 数组,形状(n,...)
纵坐标。
- k: 整数,可选
B-spline学位。默认为立方体,
k = 3。- t: 数组,形状(nt + k + 1,),可选。
结。结的数量需要与数据点的数量和边导数的数量一致。具体来说,
nt - n必须等于len(deriv_l) + len(deriv_r)。- bc_type: 2 元组或无
边界条件。默认为 None,这意味着自动选择边界条件。否则,它必须是 length-two 元组,其中第一个元素 (
deriv_l) 在x[0]设置边界条件,第二个元素 (deriv_r) 在x[-1]设置边界条件。其中每个都必须是可迭代的对(order, value),它给出插值间隔给定边处指定阶导数的值。或者,可以识别以下字符串别名:"clamped":末端的一阶导数为零。这是相当于
bc_type=([(1, 0.0)], [(1, 0.0)])。
"natural":末端的二阶导数为零。这相当于bc_type=([(2, 0.0)], [(2, 0.0)])。"not-a-knot"(默认):第一段和第二段是相同的多项式。这相当于拥有bc_type=None。"periodic":值和末尾的第一个k-1导数是等价的。
- axis: 整数,可选
插值轴。默认值为 0。
- check_finite: 布尔型,可选
是否检查输入数组是否仅包含有限数。禁用可能会提高性能,但如果输入确实包含无穷大或 NaN,则可能会导致问题(崩溃、非终止)。默认为真。
- b: 度数为
k并带有结t的 BSpline 对象。
- b: 度数为
参数 ::
返回 ::
例子:
在 Chebyshev 节点上使用三次插值:
>>> import numpy as np
>>> import matplotlib.pyplot as plt
>>> def cheb_nodes(N):
...     jj = 2.*np.arange(N) + 1
...     x = np.cos(np.pi * jj / 2 / N)[::-1]
...     return x
>>> x = cheb_nodes(20) >>> y = np.sqrt(1 - x**2)>>> from scipy.interpolate import BSpline, make_interp_spline >>> b = make_interp_spline(x, y) >>> np.allclose(b(x), y) True请注意,默认为具有 not-a-knot 边界条件的三次样条
>>> b.k
3
在这里,我们使用 ‘natural’ 样条曲线,边处的二阶导数为零:
>>> l, r = [(2, 0.0)], [(2, 0.0)]
>>> b_n = make_interp_spline(x, y, bc_type=(l, r))  # or, bc_type="natural"
>>> np.allclose(b_n(x), y)
True
>>> x0, x1 = x[0], x[-1]
>>> np.allclose([b_n(x0, 2), b_n(x1, 2)], [0, 0])
True
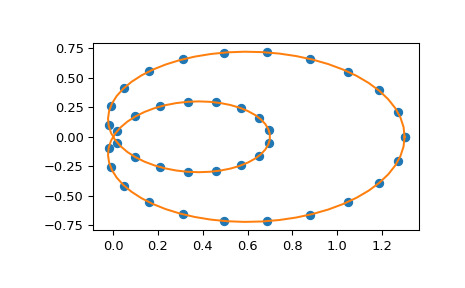
还支持参数曲线的插值。例如,我们计算极坐标中蜗牛曲线的离散化
>>> phi = np.linspace(0, 2.*np.pi, 40)
>>> r = 0.3 + np.cos(phi)
>>> x, y = r*np.cos(phi), r*np.sin(phi)  # convert to Cartesian coordinates
构建插值曲线,通过角度对其进行参数化
>>> spl = make_interp_spline(phi, np.c_[x, y])在更精细的网格上评估插值(请注意,我们转置结果以将其解包为一对 x- 和 y-arrays)
>>> phi_new = np.linspace(0, 2.*np.pi, 100)
>>> x_new, y_new = spl(phi_new).T
绘制结果
>>> plt.plot(x, y, 'o')
>>> plt.plot(x_new, y_new, '-')
>>> plt.show()
用 2 维 y 构建 B-spline 曲线
>>> x = np.linspace(0, 2*np.pi, 10)
>>> y = np.array([np.sin(x), np.cos(x)])
满足周期性条件,因为两端点的 y 坐标相等
>>> ax = plt.axes(projection='3d')
>>> xx = np.linspace(0, 2*np.pi, 100)
>>> bspl = make_interp_spline(x, y, k=5, bc_type='periodic', axis=1)
>>> ax.plot3D(xx, *bspl(xx))
>>> ax.scatter3D(x, *y, color='red')
>>> plt.show()
相关用法
- Python SciPy interpolate.make_smoothing_spline用法及代码示例
- Python SciPy interpolate.make_lsq_spline用法及代码示例
- Python SciPy interpolate.krogh_interpolate用法及代码示例
- Python SciPy interpolate.InterpolatedUnivariateSpline用法及代码示例
- Python SciPy interpolate.BSpline用法及代码示例
- Python SciPy interpolate.LSQSphereBivariateSpline用法及代码示例
- Python SciPy interpolate.griddata用法及代码示例
- Python SciPy interpolate.splder用法及代码示例
- Python SciPy interpolate.LinearNDInterpolator用法及代码示例
- Python SciPy interpolate.PPoly用法及代码示例
- Python SciPy interpolate.NdBSpline用法及代码示例
- Python SciPy interpolate.pade用法及代码示例
- Python SciPy interpolate.barycentric_interpolate用法及代码示例
- Python SciPy interpolate.RegularGridInterpolator用法及代码示例
- Python SciPy interpolate.NdPPoly用法及代码示例
- Python SciPy interpolate.interp2d用法及代码示例
- Python SciPy interpolate.approximate_taylor_polynomial用法及代码示例
- Python SciPy interpolate.RectSphereBivariateSpline用法及代码示例
- Python SciPy interpolate.sproot用法及代码示例
- Python SciPy interpolate.splantider用法及代码示例
- Python SciPy interpolate.CloughTocher2DInterpolator用法及代码示例
- Python SciPy interpolate.interp1d用法及代码示例
- Python SciPy interpolate.BPoly用法及代码示例
- Python SciPy interpolate.BarycentricInterpolator用法及代码示例
- Python SciPy interpolate.splrep用法及代码示例
注:本文由纯净天空筛选整理自scipy.org大神的英文原创作品 scipy.interpolate.make_interp_spline。非经特殊声明,原始代码版权归原作者所有,本译文未经允许或授权,请勿转载或复制。
