本文简要介绍 python 语言中 scipy.interpolate.BarycentricInterpolator 的用法。
用法:
class scipy.interpolate.BarycentricInterpolator(xi, yi=None, axis=0, *, wi=None, random_state=None)#对一组点进行插值多项式。
构造一个通过给定点集的多项式。允许评估多项式及其所有导数、有效更改要插值的 y-values,以及通过添加更多 x- 和 y-values 进行更新。
出于数值稳定性的原因,该函数不计算多项式的系数。
需要在计算函数之前提供 yi 值,但任何预处理都不依赖于它们,因此可以快速更新。
- xi: 类似数组,形状 (npoints, )
多项式应通过的点的 x 坐标的一维数组
- yi: 数组,形状(...,npoints,...),可选
N-D 多项式应经过的点的 y 坐标数组。如果没有,则 y 值稍后将通过set_y方法。长度为义沿插补轴的长度必须等于xi。使用
axis参数来选择正确的轴。- axis: 整数,可选
yi 数组中的轴对应于 x 坐标值。默认为
axis=0。- wi: 数组,可选
所选插值点 xi 的重心权重。如果不存在或无,则权重将从 xi (默认)计算。如果使用相同节点 xi 计算多个插值,则这允许重新使用权重 wi,而无需重新计算。
- random_state: {无,int,
numpy.random.Generator,numpy.random.RandomState},可选 如果种子是无(或np.random), 这
numpy.random.RandomState使用单例。如果种子是一个 int,一个新的RandomState使用实例,播种种子.如果种子已经是一个Generator或者RandomState实例然后使用该实例。
参数 ::
注意:
此类使用 “barycentric interpolation” 方法,将问题视为有理函数插值的特殊情况。该算法在数值上相当稳定,但即使在精确计算的世界中,除非非常仔细地选择 x 坐标 - 切比雪夫零点(例如,cos(i*pi/n))是一个不错的选择 - 多项式插值本身就是一个由于龙格现象,非常ill-conditioned过程。
基于 Berrut 和 Trefethen 2004 年,“Barycentric Lagrange Interpolation”。
例子:
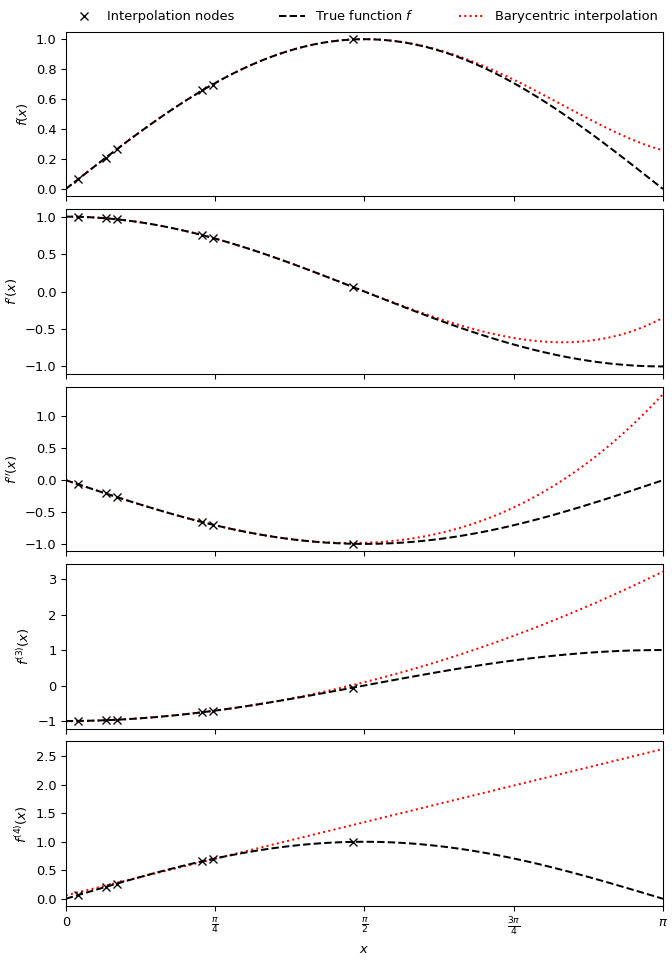
要生成逼近函数 及其前四个导数的五次重心插值,请使用 中的六个 randomly-spaced 节点:
>>> import numpy as np
>>> import matplotlib.pyplot as plt
>>> from scipy.interpolate import BarycentricInterpolator
>>> rng = np.random.default_rng()
>>> xi = rng.random(6) * np.pi/2
>>> f, f_d1, f_d2, f_d3, f_d4 = np.sin, np.cos, lambda x: -np.sin(x), lambda x: -np.cos(x), np.sin
>>> P = BarycentricInterpolator(xi, f(xi), random_state=rng)
>>> fig, axs = plt.subplots(5, 1, sharex=True, layout='constrained', figsize=(7,10))
>>> x = np.linspace(0, np.pi, 100)
>>> axs[0].plot(x, P(x), 'r:', x, f(x), 'k--', xi, f(xi), 'xk')
>>> axs[1].plot(x, P.derivative(x), 'r:', x, f_d1(x), 'k--', xi, f_d1(xi), 'xk')
>>> axs[2].plot(x, P.derivative(x, 2), 'r:', x, f_d2(x), 'k--', xi, f_d2(xi), 'xk')
>>> axs[3].plot(x, P.derivative(x, 3), 'r:', x, f_d3(x), 'k--', xi, f_d3(xi), 'xk')
>>> axs[4].plot(x, P.derivative(x, 4), 'r:', x, f_d4(x), 'k--', xi, f_d4(xi), 'xk')
>>> axs[0].set_xlim(0, np.pi)
>>> axs[4].set_xlabel(r"$x$")
>>> axs[4].set_xticks([i * np.pi / 4 for i in range(5)],
...                   ["0", r"$\frac{\pi}{4}$", r"$\frac{\pi}{2}$", r"$\frac{3\pi}{4}$", r"$\pi$"])
>>> axs[0].set_ylabel("$f(x)$")
>>> axs[1].set_ylabel("$f'(x)$")
>>> axs[2].set_ylabel("$f''(x)$")
>>> axs[3].set_ylabel("$f^{(3)}(x)$")
>>> axs[4].set_ylabel("$f^{(4)}(x)$")
>>> labels = ['Interpolation nodes', 'True function $f$', 'Barycentric interpolation']
>>> axs[0].legend(axs[0].get_lines()[::-1], labels, bbox_to_anchor=(0., 1.02, 1., .102),
...               loc='lower left', ncols=3, mode="expand", borderaxespad=0., frameon=False)
>>> plt.show()
- dtype:
属性 ::
相关用法
- Python SciPy interpolate.BSpline用法及代码示例
- Python SciPy interpolate.BPoly用法及代码示例
- Python SciPy interpolate.make_interp_spline用法及代码示例
- Python SciPy interpolate.krogh_interpolate用法及代码示例
- Python SciPy interpolate.InterpolatedUnivariateSpline用法及代码示例
- Python SciPy interpolate.LSQSphereBivariateSpline用法及代码示例
- Python SciPy interpolate.griddata用法及代码示例
- Python SciPy interpolate.splder用法及代码示例
- Python SciPy interpolate.LinearNDInterpolator用法及代码示例
- Python SciPy interpolate.PPoly用法及代码示例
- Python SciPy interpolate.NdBSpline用法及代码示例
- Python SciPy interpolate.pade用法及代码示例
- Python SciPy interpolate.barycentric_interpolate用法及代码示例
- Python SciPy interpolate.RegularGridInterpolator用法及代码示例
- Python SciPy interpolate.NdPPoly用法及代码示例
- Python SciPy interpolate.interp2d用法及代码示例
- Python SciPy interpolate.approximate_taylor_polynomial用法及代码示例
- Python SciPy interpolate.RectSphereBivariateSpline用法及代码示例
- Python SciPy interpolate.sproot用法及代码示例
- Python SciPy interpolate.splantider用法及代码示例
- Python SciPy interpolate.CloughTocher2DInterpolator用法及代码示例
- Python SciPy interpolate.interp1d用法及代码示例
- Python SciPy interpolate.splrep用法及代码示例
- Python SciPy interpolate.make_smoothing_spline用法及代码示例
- Python SciPy interpolate.Rbf用法及代码示例
注:本文由纯净天空筛选整理自scipy.org大神的英文原创作品 scipy.interpolate.BarycentricInterpolator。非经特殊声明,原始代码版权归原作者所有,本译文未经允许或授权,请勿转载或复制。
