本文簡要介紹 python 語言中 scipy.stats.ppcc_max 的用法。
用法:
scipy.stats.ppcc_max(x, brack=(0.0, 1.0), dist='tukeylambda')#計算使 PPCC 最大化的形狀參數。
概率圖相關係數 (PPCC) 圖可用於確定單參數分布族的最佳形狀參數。
ppcc_max返回形狀參數,該形狀參數將使給定數據的概率圖相關係數最大化到單參數分布族。- x: array_like
輸入數組。
- brack: 元組,可選
三元組 (a,b,c),其中 (a<b<c)。如果括號由兩個數字 (a, c) 組成,則假定它們是下坡括號搜索的起始區間(請參閱
scipy.optimize.brent)。- dist: str 或 stats.distributions 實例,可選
分布或分布函數名稱。看起來足夠像 stats.distributions 實例的對象(即它們具有
ppf方法)也被接受。默認為'tukeylambda'。
- shape_value: 浮點數
概率圖相關係數達到最大值時的形狀參數。
參數 ::
返回 ::
注意:
brack 關鍵字用作在極端情況下有用的起點。可以使用繪圖來獲得對位置的粗略視覺估計,以便在其附近開始搜索。
參考:
[1]J.J. Filliben,“正態性概率圖相關係數檢驗”,技術計量學,卷。 17,第 111-117 頁,1975 年。
[2]工程統計手冊,NIST/SEMATEC,https://www.itl.nist.gov/div898/handbook/eda/section3/ppccplot.htm
例子:
首先,我們從形狀參數為 2.5 的 Weibull 分布生成一些隨機數據:
>>> import numpy as np
>>> from scipy import stats
>>> import matplotlib.pyplot as plt
>>> rng = np.random.default_rng()
>>> c = 2.5
>>> x = stats.weibull_min.rvs(c, scale=4, size=2000, random_state=rng)
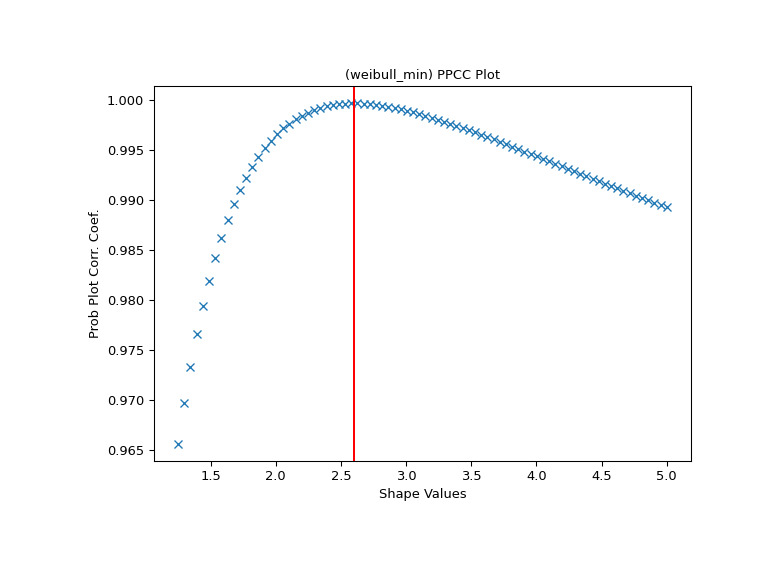
使用 Weibull 分布為該數據生成 PPCC 圖。
>>> fig, ax = plt.subplots(figsize=(8, 6))
>>> res = stats.ppcc_plot(x, c/2, 2*c, dist='weibull_min', plot=ax)
我們計算形狀應該達到最大值的值,並在那裏畫一條紅線。該線應與 PPCC 圖中的最高點重合。
>>> cmax = stats.ppcc_max(x, brack=(c/2, 2*c), dist='weibull_min')
>>> ax.axvline(cmax, color='r')
>>> plt.show()
相關用法
- Python SciPy stats.ppcc_plot用法及代碼示例
- Python SciPy stats.page_trend_test用法及代碼示例
- Python SciPy stats.poisson用法及代碼示例
- Python SciPy stats.poisson_means_test用法及代碼示例
- Python SciPy stats.pareto用法及代碼示例
- Python SciPy stats.planck用法及代碼示例
- Python SciPy stats.pointbiserialr用法及代碼示例
- Python SciPy stats.probplot用法及代碼示例
- Python SciPy stats.powerlognorm用法及代碼示例
- Python SciPy stats.pmean用法及代碼示例
- Python SciPy stats.powerlaw用法及代碼示例
- Python SciPy stats.power_divergence用法及代碼示例
- Python SciPy stats.powernorm用法及代碼示例
- Python SciPy stats.pearson3用法及代碼示例
- Python SciPy stats.pearsonr用法及代碼示例
- Python SciPy stats.percentileofscore用法及代碼示例
- Python SciPy stats.permutation_test用法及代碼示例
- Python SciPy stats.anderson用法及代碼示例
- Python SciPy stats.iqr用法及代碼示例
- Python SciPy stats.genpareto用法及代碼示例
- Python SciPy stats.skewnorm用法及代碼示例
- Python SciPy stats.cosine用法及代碼示例
- Python SciPy stats.norminvgauss用法及代碼示例
- Python SciPy stats.directional_stats用法及代碼示例
- Python SciPy stats.invwishart用法及代碼示例
注:本文由純淨天空篩選整理自scipy.org大神的英文原創作品 scipy.stats.ppcc_max。非經特殊聲明,原始代碼版權歸原作者所有,本譯文未經允許或授權,請勿轉載或複製。
