本文簡要介紹 python 語言中 scipy.spatial.delaunay_plot_2d 的用法。
用法:
scipy.spatial.delaunay_plot_2d(tri, ax=None)#在二維中繪製給定的 Delaunay 三角剖分
- tri: scipy.spatial.Delaunay 實例
三角剖分繪圖
- ax: matplotlib.axes.Axes 實例,可選
要繪製的軸
- fig: matplotlib.figure.Figure 實例
圖的圖
參數 ::
返回 ::
注意:
需要 Matplotlib。
例子:
>>> import numpy as np
>>> import matplotlib.pyplot as plt
>>> from scipy.spatial import Delaunay, delaunay_plot_2d
一組隨機點的 Delaunay 三角剖分:
>>> rng = np.random.default_rng()
>>> points = rng.random((30, 2))
>>> tri = Delaunay(points)
繪製它:
>>> _ = delaunay_plot_2d(tri)
>>> plt.show()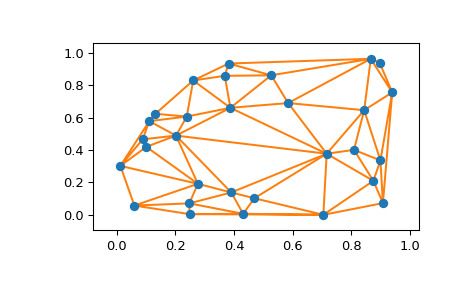
相關用法
- Python SciPy spatial.distance_matrix用法及代碼示例
- Python SciPy spatial.tsearch用法及代碼示例
- Python SciPy spatial.Voronoi用法及代碼示例
- Python SciPy spatial.procrustes用法及代碼示例
- Python SciPy spatial.SphericalVoronoi用法及代碼示例
- Python SciPy spatial.minkowski_distance用法及代碼示例
- Python SciPy spatial.HalfspaceIntersection用法及代碼示例
- Python SciPy spatial.voronoi_plot_2d用法及代碼示例
- Python SciPy spatial.minkowski_distance_p用法及代碼示例
- Python SciPy spatial.geometric_slerp用法及代碼示例
- Python SciPy spatial.ConvexHull用法及代碼示例
- Python SciPy spatial.convex_hull_plot_2d用法及代碼示例
- Python SciPy spatial.Delaunay用法及代碼示例
- Python SciPy sparse.isspmatrix用法及代碼示例
- Python SciPy sparse.save_npz用法及代碼示例
- Python SciPy sparse.issparse用法及代碼示例
- Python SciPy sparse.coo_matrix用法及代碼示例
- Python SciPy sparse.isspmatrix_csc用法及代碼示例
- Python SciPy sparse.isspmatrix_csr用法及代碼示例
- Python SciPy sparse.tril用法及代碼示例
- Python SciPy sparse.coo_array用法及代碼示例
- Python SciPy sparse.dia_array用法及代碼示例
- Python SciPy sparse.bmat用法及代碼示例
- Python SciPy sparse.hstack用法及代碼示例
- Python SciPy sparse.rand用法及代碼示例
注:本文由純淨天空篩選整理自scipy.org大神的英文原創作品 scipy.spatial.delaunay_plot_2d。非經特殊聲明,原始代碼版權歸原作者所有,本譯文未經允許或授權,請勿轉載或複製。