本文简要介绍 python 语言中 scipy.signal.unit_impulse 的用法。
用法:
scipy.signal.unit_impulse(shape, idx=None, dtype=<class 'float'>)#单位脉冲信号(离散增量函数)或单位基向量。
- shape: int 或 int 的元组
输出中的样本数 (1-D),或表示输出形状的元组 (N-D)。
- idx: 无或int或int或‘mid’的元组,可选
值为 1 的索引。如果为 None,则默认为第 0 个元素。如果
idx='mid', 冲量将集中在shape // 2在所有维度。如果是 int,则冲动将在编号在所有维度。- dtype: 数据类型,可选
数组所需的数据类型,例如
numpy.int8。默认为numpy.float64。
- y: ndarray
包含脉冲信号的输出数组。
参数 ::
返回 ::
注意:
一维情况也称为克罗内克三角洲。
例子:
第 0 个元素()的脉冲:
>>> from scipy import signal
>>> signal.unit_impulse(8)
array([ 1.,  0.,  0.,  0.,  0.,  0.,  0.,  0.])
脉冲偏移 2 个样本():
>>> signal.unit_impulse(7, 2)
array([ 0.,  0.,  1.,  0.,  0.,  0.,  0.])
二维脉冲,居中:
>>> signal.unit_impulse((3, 3), 'mid')
array([[ 0.,  0.,  0.],
       [ 0.,  1.,  0.],
       [ 0.,  0.,  0.]])
脉冲在 (2, 2),使用广播:
>>> signal.unit_impulse((4, 4), 2)
array([[ 0.,  0.,  0.,  0.],
       [ 0.,  0.,  0.,  0.],
       [ 0.,  0.,  1.,  0.],
       [ 0.,  0.,  0.,  0.]])
绘制 4th-order Butterworth 低通滤波器的脉冲响应:
>>> imp = signal.unit_impulse(100, 'mid')
>>> b, a = signal.butter(4, 0.2)
>>> response = signal.lfilter(b, a, imp)
>>> import numpy as np >>> import matplotlib.pyplot as plt >>> plt.plot(np.arange(-50, 50), imp) >>> plt.plot(np.arange(-50, 50), response) >>> plt.margins(0.1, 0.1) >>> plt.xlabel('Time [samples]') >>> plt.ylabel('Amplitude') >>> plt.grid(True) >>> plt.show()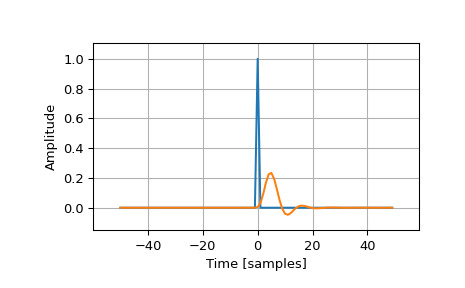
相关用法
- Python SciPy signal.unique_roots用法及代码示例
- Python SciPy signal.upfirdn用法及代码示例
- Python SciPy signal.czt_points用法及代码示例
- Python SciPy signal.chirp用法及代码示例
- Python SciPy signal.residue用法及代码示例
- Python SciPy signal.iirdesign用法及代码示例
- Python SciPy signal.max_len_seq用法及代码示例
- Python SciPy signal.kaiser_atten用法及代码示例
- Python SciPy signal.oaconvolve用法及代码示例
- Python SciPy signal.hilbert用法及代码示例
- Python SciPy signal.ricker用法及代码示例
- Python SciPy signal.group_delay用法及代码示例
- Python SciPy signal.cheb2ord用法及代码示例
- Python SciPy signal.get_window用法及代码示例
- Python SciPy signal.lfilter用法及代码示例
- Python SciPy signal.morlet用法及代码示例
- Python SciPy signal.coherence用法及代码示例
- Python SciPy signal.dfreqresp用法及代码示例
- Python SciPy signal.TransferFunction用法及代码示例
- Python SciPy signal.dbode用法及代码示例
- Python SciPy signal.residuez用法及代码示例
- Python SciPy signal.bilinear_zpk用法及代码示例
- Python SciPy signal.firls用法及代码示例
- Python SciPy signal.impulse用法及代码示例
- Python SciPy signal.buttord用法及代码示例
注:本文由纯净天空筛选整理自scipy.org大神的英文原创作品 scipy.signal.unit_impulse。非经特殊声明,原始代码版权归原作者所有,本译文未经允许或授权,请勿转载或复制。