用法:
pandas.plotting.scatter_matrix(frame, alpha=0.5, figsize=None, ax=None, grid=False, diagonal='hist', marker='.', density_kwds=None, hist_kwds=None, range_padding=0.05, **kwargs)绘制散点图矩阵。
- frame: DataFrame
- alpha:浮点数,可选
应用的透明度量。
- figsize:(浮点数,浮点数),可选
以英寸为单位的元组(宽度,高度)。
- ax:Matplotlib 轴对象,可选
- grid:布尔型,可选
将此设置为 True 将显示网格。
- diagonal:{‘hist’, ‘kde’}
在‘kde’ and ‘hist’ 之间选择核密度估计或对角线直方图。
- marker:str,可选
Matplotlib 标记类型,默认为“.”。
- density_kwds:关键词
要传递给核密度估计图的关键字参数。
- hist_kwds:关键词
要传递给 hist 函数的关键字参数。
- range_padding:浮点数,默认 0.05
x 和 y 轴范围相对于 (x_max - x_min) 或 (y_max - y_min) 的相对扩展。
- **kwargs:
要传递给 scatter 函数的关键字参数。
- numpy.ndarray
散点图矩阵。
参数:
返回:
例子:
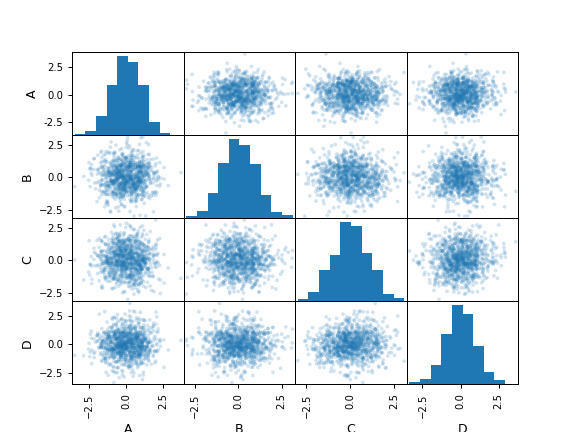
>>> df = pd.DataFrame(np.random.randn(1000, 4), columns=['A','B','C','D'])
>>> pd.plotting.scatter_matrix(df, alpha=0.2)
array([[<AxesSubplot:xlabel='A', ylabel='A'>,
    <AxesSubplot:xlabel='B', ylabel='A'>,
    <AxesSubplot:xlabel='C', ylabel='A'>,
    <AxesSubplot:xlabel='D', ylabel='A'>],
   [<AxesSubplot:xlabel='A', ylabel='B'>,
    <AxesSubplot:xlabel='B', ylabel='B'>,
    <AxesSubplot:xlabel='C', ylabel='B'>,
    <AxesSubplot:xlabel='D', ylabel='B'>],
   [<AxesSubplot:xlabel='A', ylabel='C'>,
    <AxesSubplot:xlabel='B', ylabel='C'>,
    <AxesSubplot:xlabel='C', ylabel='C'>,
    <AxesSubplot:xlabel='D', ylabel='C'>],
   [<AxesSubplot:xlabel='A', ylabel='D'>,
    <AxesSubplot:xlabel='B', ylabel='D'>,
    <AxesSubplot:xlabel='C', ylabel='D'>,
    <AxesSubplot:xlabel='D', ylabel='D'>]], dtype=object)
相关用法
- Python pandas.plotting.autocorrelation_plot用法及代码示例
- Python pandas.plotting.bootstrap_plot用法及代码示例
- Python pandas.plotting.radviz用法及代码示例
- Python pandas.plotting.parallel_coordinates用法及代码示例
- Python pandas.plotting.andrews_curves用法及代码示例
- Python pandas.plotting.lag_plot用法及代码示例
- Python pandas.plotting.boxplot用法及代码示例
- Python pandas.pivot用法及代码示例
- Python pandas.period_range用法及代码示例
- Python pandas.period_range()用法及代码示例
- Python pandas.pivot_table用法及代码示例
- Python pandas.arrays.IntervalArray.is_empty用法及代码示例
- Python pandas.DataFrame.ewm用法及代码示例
- Python pandas.api.types.is_timedelta64_ns_dtype用法及代码示例
- Python pandas.DataFrame.dot用法及代码示例
- Python pandas.DataFrame.apply用法及代码示例
- Python pandas.DataFrame.combine_first用法及代码示例
- Python pandas.read_pickle用法及代码示例
- Python pandas.Index.value_counts用法及代码示例
- Python pandas.DatetimeTZDtype用法及代码示例
注:本文由纯净天空筛选整理自pandas.pydata.org大神的英文原创作品 pandas.plotting.scatter_matrix。非经特殊声明,原始代码版权归原作者所有,本译文未经允许或授权,请勿转载或复制。
