等高线图或水平图是在二维平面上显示三维表面的一种方式。它以轮廓图的形式在y轴上作为一个输出变量z和两个预测变量x和y。通常,此类轮廓也称为z-slices。
mathplotlib.pyplot中的clabel()方法用于在类的实例中为线轮廓添加标签,以支持轮廓绘制。
用法: matplotlib.pyplot.clabel(CS, levels=None, **kwargs)
参数:
- CS:要标记的ContourSet。
- levels:级别值列表,应标记出来。该列表必须是CS.levels的子集。如果未给出,则标记所有级别。它是一个可选参数(默认值为None)。
- fontsize:以磅为单位的尺寸或相对尺寸,例如‘smaller’,“ x-large”。有关可接受的字符串值,请参见Text.set_size。
- colors:标签颜色-
- 如果为无,则每个标签的颜色与相应轮廓的颜色匹配。
- 如果使用一种字符串颜色(例如,颜色= ‘r’或颜色= ‘red’),则所有标签都将以此颜色绘制。
- 如果是matplotlib颜色args(字符串,float,rgb等)的元组,则将按照指定的顺序以不同的颜色绘制不同的标签。
以下是一些程序来说明matplotlib.pyplot.clabel()的用法:
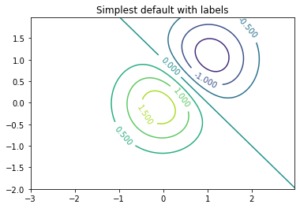
范例1:使用默认颜色创建带有标签的简单轮廓图。 clabel的inline参数将控制是否在轮廓的线段上绘制标签,从而删除标签下方的线。
Python3
# importing the required libraries
import numpy
import matplotlib.pyplot

# creating the graph
delta = 0.025
x = numpy.arange(-3.0, 3.0, delta)
y = numpy.arange(-2.0, 2.0, delta)
X, Y = numpy.meshgrid(x, y)

Z1 = numpy.exp(-X**2 - Y**2)
Z2 = numpy.exp(-(X - 1)**2 - (Y - 1)**2)
Z = (Z1 - Z2) * 2

# adding labels to the line contours
fig, ax = matplotlib.pyplot.subplots()
CS = ax.contour(X, Y, Z)
ax.clabel(CS, inline=1, fontsize=10)
ax.set_title('Simplest default with labels')
输出:
范例2:通过提供位置列表(在数据坐标中),可以手动放置轮廓标签。有关交互式放置,请参见ginput_manual_clabel.py。
Python3
# importing the required libraries
import numpy
import matplotlib.pyplot

# creating the graph
delta = 0.025
x = numpy.arange(-3.0, 3.0, delta)
y = numpy.arange(-2.0, 2.0, delta)
X, Y = numpy.meshgrid(x, y)

Z1 = numpy.exp(-X**2 - Y**2)
Z2 = numpy.exp(-(X - 1)**2 - (Y - 1)**2)
Z = (Z1 - Z2) * 2

# adding labels to the line contours
fig, ax = matplotlib.pyplot.subplots()
CS = ax.contour(X, Y, Z)
manual_locations = [(-1, -1.4), (-0.62, -0.7),
                    (-2, 0.5), (1.7, 1.2),
                    (2.0, 1.4), (2.4, 1.7)]

ax.clabel(CS, inline=1, fontsize=10, manual=manual_locations)
ax.set_title('labels at selected locations')
输出:

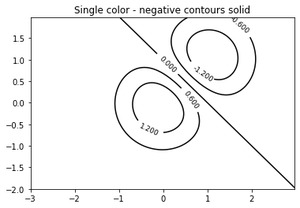
范例3:您可以强制所有轮廓为相同颜色。
Python3
# importing the required libraries
import numpy
import matplotlib.pyplot

# creating the graph
delta = 0.025
x = numpy.arange(-3.0, 3.0, delta)
y = numpy.arange(-2.0, 2.0, delta)
X, Y = numpy.meshgrid(x, y)

Z1 = numpy.exp(-X**2 - Y**2)
Z2 = numpy.exp(-(X - 1)**2 - (Y - 1)**2)
Z = (Z1 - Z2) * 2

# adding labels to the line contours
fig, ax = matplotlib.pyplot.subplots()
CS = ax.contour(X, Y, Z, 6,
                 colors='k',
                 )

ax.clabel(CS, fontsize=9, inline=1)
ax.set_title('Single color - negative contours dashed')
输出:
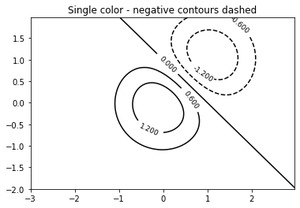
范例4:您可以将负轮廓设置为实线而不是虚线:
Python3
# importing the required libraries
import numpy
import matplotlib.pyplot

# creating the graph
delta = 0.025
x = numpy.arange(-3.0, 3.0, delta)
y = numpy.arange(-2.0, 2.0, delta)
X, Y = numpy.meshgrid(x, y)

Z1 = numpy.exp(-X**2 - Y**2)
Z2 = numpy.exp(-(X - 1)**2 - (Y - 1)**2)
Z = (Z1 - Z2) * 2

# adding labels to the line contours
matplotlib.rcParams['contour.negative_linestyle'] = 'solid'
fig, ax = matplotlib.pyplot.subplots()
CS = ax.contour(X, Y, Z, 6,
                 colors='k',
                 )

ax.clabel(CS, fontsize=9, inline=1)
ax.set_title('Single color - negative contours solid')
输出:
范例5:您可以手动指定轮廓的颜色。
Python3
# importing the required libraries
import numpy
import matplotlib.pyplot

# creating the graph
delta = 0.025
x = numpy.arange(-3.0, 3.0, delta)
y = numpy.arange(-2.0, 2.0, delta)
X, Y = numpy.meshgrid(x, y)

Z1 = numpy.exp(-X**2 - Y**2)
Z2 = numpy.exp(-(X - 1)**2 - (Y - 1)**2)
Z = (Z1 - Z2) * 2

# adding labels to the line contours
fig, ax = matplotlib.pyplot.subplots()
CS = ax.contour(X, Y, Z, 6,
                 linewidths=np.arange(.5, 4, .5),
                 colors=('r', 'green', 'blue',
                         (1, 1, 0), '#afeeee', '0.5')
                 )

ax.clabel(CS, fontsize=9, inline=1)
ax.set_title('Crazy lines')
输出:

相关用法
- Python Matplotlib.pyplot.cla()用法及代码示例
- Python Matplotlib.pyplot.csd()用法及代码示例
- Python Matplotlib.pyplot.clf()用法及代码示例
- Python matplotlib.pyplot.jet()用法及代码示例
- Python Matplotlib.pyplot.gca()用法及代码示例
- Python Matplotlib.pyplot.hot()用法及代码示例
- Python Matplotlib.pyplot.hsv()用法及代码示例
- Python Matplotlib.pyplot.sca()用法及代码示例
- Python Matplotlib.pyplot.psd()用法及代码示例
- Python Matplotlib.pyplot.gci()用法及代码示例
- Python Matplotlib.pyplot.rc()用法及代码示例
- Python Matplotlib.pyplot.gcf()用法及代码示例
- Python Matplotlib.pyplot.ion()用法及代码示例
- Python Matplotlib.pyplot.sci()用法及代码示例
- Python Matplotlib.pyplot.rcdefaults()用法及代码示例
- Python Matplotlib.pyplot.rc_context()用法及代码示例
- Python Matplotlib.patches.PathPatch用法及代码示例
注:本文由纯净天空筛选整理自riturajsaha大神的英文原创作品 matplotlib.pyplot.clabel() in Python。非经特殊声明,原始代码版权归原作者所有,本译文未经允许或授权,请勿转载或复制。