Matplotlib是Python中的一个库,它是数字的-NumPy库的数学扩展。 Pyplot是Matplotlib模块的基于状态的接口,该模块提供了MATLAB-like接口。在Pyplot中可以使用各种图,例如线图,轮廓图,直方图,散点图,3D图等。
matplotlib.pyplot.clf()函数
matplotlib库的pyplot模块中的cla()函数用于清除当前图形。句法:
matplotlib.pyplot.clf()
以下示例说明了matplotlib.pyplot中的matplotlib.pyplot.clf()函数:
范例1:
# Implementation of matplotlib function
import matplotlib.pyplot as plt

plt.plot([1, 2, 3, 4], [16, 4, 1, 8])
plt.clf()

plt.title('matplotlib.pyplot.clf Example')
plt.show()
输出:
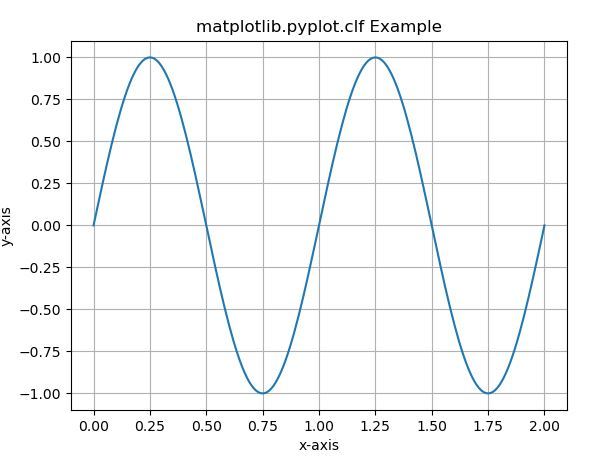
范例2:
# Implementation of matplotlib function
import numpy as np
import matplotlib.pyplot as plt

t = np.linspace(0.0, 2.0, 201)
s = np.sin(2 * np.pi * t)

plt.ylabel('y-axis')
plt.xlabel('x-axis')
plt.plot(t, s)
plt.grid(True)
plt.clf()

plt.title('matplotlib.pyplot.clf Example')
plt.show()
输出:
使用clf()函数之前
使用clf()函数后
注:本文由纯净天空筛选整理自SHUBHAMSINGH10大神的英文原创作品 Matplotlib.pyplot.clf() in Python。非经特殊声明,原始代码版权归原作者所有,本译文未经允许或授权,请勿转载或复制。