Matplotlib是Python中的一個庫,它是數字的-NumPy庫的數學擴展。 Pyplot是Matplotlib模塊的基於狀態的接口,該模塊提供了MATLAB-like接口。在Pyplot中可以使用各種圖,例如線圖,輪廓圖,直方圖,散點圖,3D圖等。
matplotlib.pyplot.clf()函數
matplotlib庫的pyplot模塊中的cla()函數用於清除當前圖形。句法:
matplotlib.pyplot.clf()
以下示例說明了matplotlib.pyplot中的matplotlib.pyplot.clf()函數:
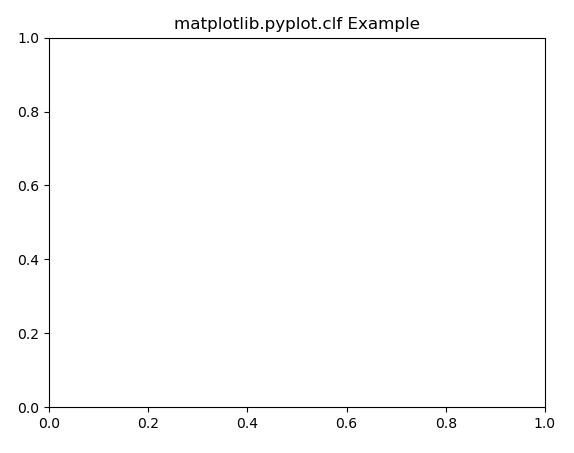
範例1:
# Implementation of matplotlib function
import matplotlib.pyplot as plt

plt.plot([1, 2, 3, 4], [16, 4, 1, 8])
plt.clf()

plt.title('matplotlib.pyplot.clf Example')
plt.show()
輸出:
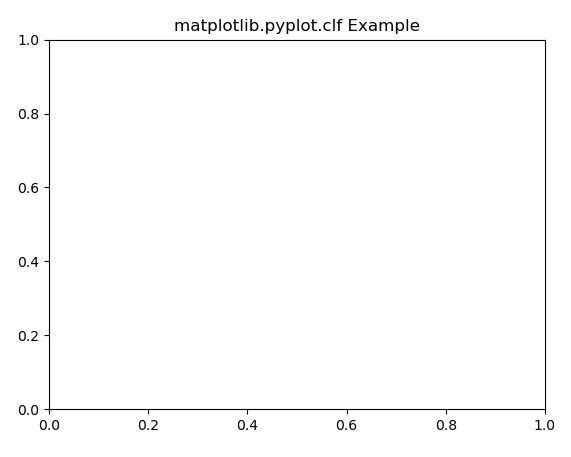
範例2:
# Implementation of matplotlib function
import numpy as np
import matplotlib.pyplot as plt

t = np.linspace(0.0, 2.0, 201)
s = np.sin(2 * np.pi * t)

plt.ylabel('y-axis')
plt.xlabel('x-axis')
plt.plot(t, s)
plt.grid(True)
plt.clf()

plt.title('matplotlib.pyplot.clf Example')
plt.show()
輸出:
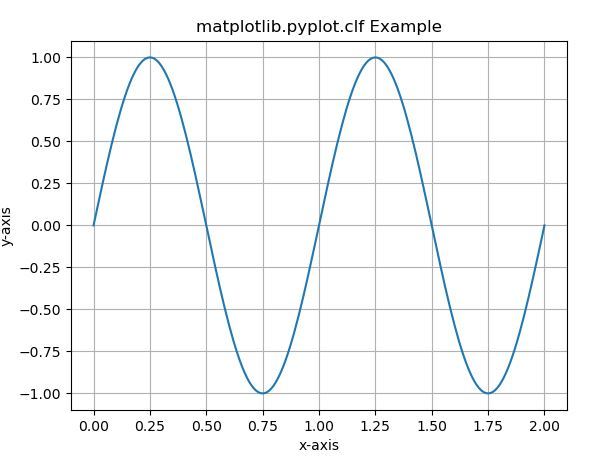
使用clf()函數之前
使用clf()函數後
注:本文由純淨天空篩選整理自SHUBHAMSINGH10大神的英文原創作品 Matplotlib.pyplot.clf() in Python。非經特殊聲明,原始代碼版權歸原作者所有,本譯文未經允許或授權,請勿轉載或複製。