Matplotlib是Python中的一个库,它是数字的-NumPy库的数学扩展。 Pyplot是Matplotlib模块的基于状态的接口,该模块提供了MATLAB-like接口。在Pyplot中可以使用各种图,例如线图,轮廓图,直方图,散点图,3D图等。
matplotlib.pyplot.rc_context()函数
matplotlib库的pyplot模块中的rc_context()函数用于返回用于管理rc设置的上下文管理器。
用法: matplotlib.pyplot.rc_context(rc=None, fname=None)
参数:
- rc:此参数是字典,也可以传递给上下文管理器。
- fname:此参数包含要调用的文件名。
返回值:此方法返回用于管理rc设置的上下文管理器。
以下示例说明了matplotlib.pyplot中的matplotlib.pyplot.rcdefaults()函数:
范例1:
# implementation of the matplotlib function
import matplotlib.pyplot as plt
import numpy as np
np.random.seed(19680801)
dots = np.arange(20)
x, y = np.meshgrid(dots, dots)
data = [x.ravel(), y.ravel()]
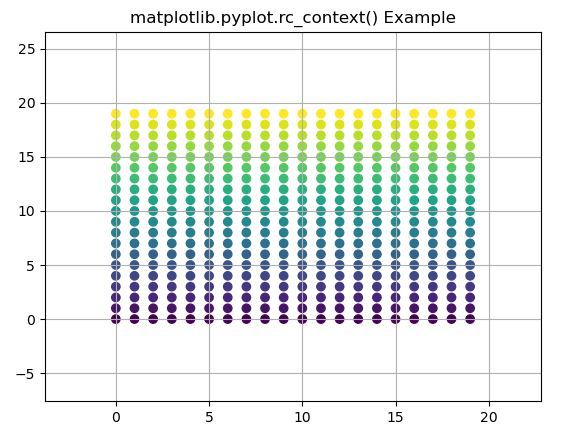
with plt.rc_context({'axes.xmargin':.2,
'axes.ymargin':.4}):
plt.scatter(*data, c = data[1])
plt.grid(True)
plt.title('matplotlib.pyplot.rc_context()\
Example')
plt.show()输出:
范例2:
# implementation of the matplotlib function
import matplotlib.pyplot as plt
import numpy as np
np.random.seed(19680801)
fig, ax = plt.subplots()
dots = np.arange(100)
x, y = np.meshgrid(dots, dots)
data = [x.ravel(), y.ravel()]
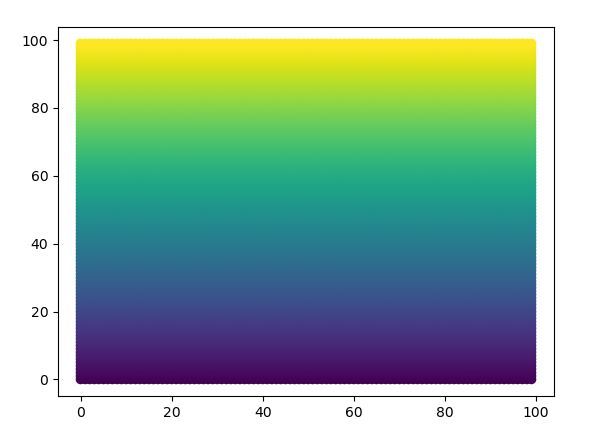
ax.scatter(*data, c = data[1])
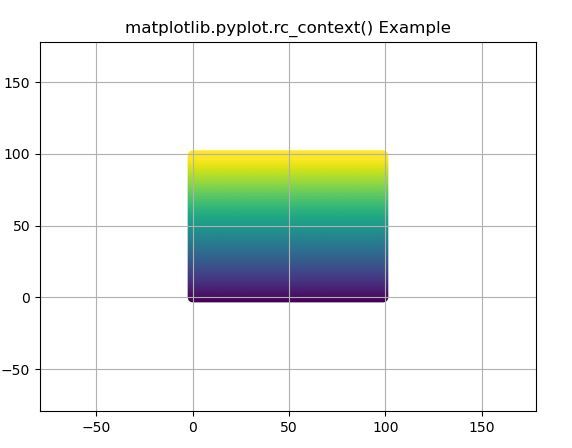
with plt.rc_context({'axes.autolimit_mode':'round_numbers',
'axes.xmargin':.8,
'axes.ymargin':.8}):
fig, ax = plt.subplots()
ax.scatter(*data, c = data[1])
plt.grid(True)
plt.title('matplotlib.pyplot.rc_context() Example')
plt.show()输出:
注:本文由纯净天空筛选整理自SHUBHAMSINGH10大神的英文原创作品 Matplotlib.pyplot.rc_context() in Python。非经特殊声明,原始代码版权归原作者所有,本译文未经允许或授权,请勿转载或复制。