Matplotlib是Python中令人惊叹的可视化库,用于二维阵列图。 Matplotlib是一个基于NumPy数组的多平台数据可视化库,旨在与更广泛的SciPy堆栈配合使用。
matplotlib.patches.PathPatch
的 matplotlib.patches.PathPatch用于绘制常规多曲线路径补丁的类。
用法: class matplotlib.patches.PathPatch(path, **kwargs)
参数:
- path:路径是
matplotlib.path.PathObject 。
下表列出了有效的kwargs参数列表:
| PROPERTY | DESCRIPTION |
|---|---|
| agg_filter | 一个过滤器函数,它使用一个(m,n,3)浮点数组和一个dpi值来返回一个(m,n,3)数组 |
| alpha | 浮点数或无 |
| animated | bool |
| 抗锯齿或抗锯齿 | unknown |
| capstyle | {‘butt’,“回合”,‘projecting’} |
| clip_box | Bbox |
| clip_on | bool |
| clip_path | [(Path,Transform)|补丁|无] |
| color | rgba元组的颜色或顺序 |
| contains | callable |
| edgecolor或ec或edgecolors | 颜色或无或‘auto’ |
| facecolor或fc或facecolors | 颜色或无 |
| figure | figure |
| fill | bool |
| gid | str |
| hatch | {‘/’、‘\’、‘|’、‘-’、‘+’、‘x’、‘o’、‘O’、‘.’、‘*’} |
| in_layout | bool |
| joinstyle | {‘miter’,“回合”,‘bevel’} |
| 线型或ls | {“-”,“-”,“-。”,“:”,“,(偏移量,on-off-seq),...} |
| 线宽或线宽或lw | 浮点数或无 |
| path_effects | AbstractPathEffect |
| picker | 无或布尔或浮点数或可赎回 |
| path_effects | AbstractPathEffect |
| picker | float或callable [[Artist,Event],Tuple [bool,dict]] |
| rasterized | 布尔还是无 |
| sketch_params | (比例:浮点数,长度:浮点数,随机性:浮点数) |
| snap | 布尔还是无 |
| transform | matplotlib.transforms.Transform |
| url | str |
| visible | bool |
| zorder | float |
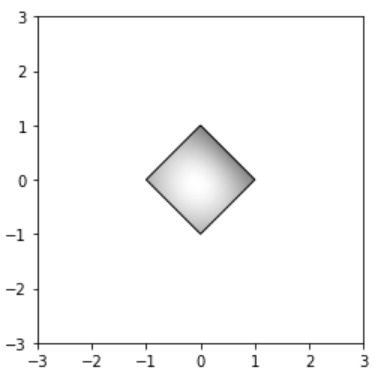
范例1:
import numpy as np
import matplotlib.cm as cm
import matplotlib.pyplot as plt
import matplotlib.cbook as cbook
from matplotlib.path import Path
from matplotlib.patches import PathPatch


delta = 0.025
x = y = np.arange(-3.0, 3.0, delta)
X, Y = np.meshgrid(x, y)
Z1 = np.exp(-X**2 - Y**2)
Z2 = np.exp(-(X - 1)**2 - (Y - 1)**2)
Z = (Z1 - Z2) * 2

path = Path([[0, 1], [1, 0], [0, -1], [-1, 0], [0, 1]])
patch = PathPatch(path, facecolor ='none')

fig, ax = plt.subplots()
ax.add_patch(patch)

im = ax.imshow(Z, interpolation ='bilinear', cmap = cm.gray,
               origin ='lower', extent =[-3, 3, -3, 3],
               clip_path = patch, clip_on = True)
im.set_clip_path(patch)

plt.show()
输出:
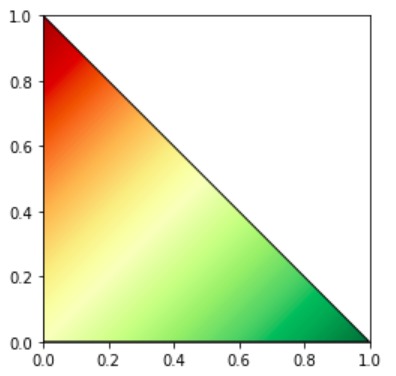
范例2:
import matplotlib.pyplot as plt
import numpy as np
from matplotlib.path import Path
from matplotlib.patches import PathPatch


fig = plt.figure()

ax = fig.add_subplot(111, aspect ='equal')
path = Path([[0, 0], [0, 1], [1, 0], [0, 0]])
patch = PathPatch(path, facecolor ='none')
ax.add_patch(patch)

Z, Z2 = np.meshgrid(np.linspace(0, 1), np.linspace(0, 1))

im = plt.imshow(Z-Z2,
                interpolation ='bilinear',
                cmap = plt.cm.RdYlGn,
                origin ='lower',
                extent =[0, 1, 0, 1],
                clip_path = patch,
                clip_on = True)

im.set_clip_path(patch)

ax.set_xlim((0, 1))
ax.set_ylim((0, 1))

plt.show()
输出:
相关用法
注:本文由纯净天空筛选整理自RajuKumar19大神的英文原创作品 Matplotlib.patches.PathPatch in Python。非经特殊声明,原始代码版权归原作者所有,本译文未经允许或授权,请勿转载或复制。