Matplotlib是Python中的一个库,它是数字的-NumPy库的数学扩展。 Pyplot是Matplotlib模块的基于状态的接口,该模块提供了MATLAB-like接口。可在Pyplot中使用的各种图线图,轮廓图,直方图,散点图,3D图等。
matplotlib.pyplot.gci()方法
matplotlib库的pyplot模块中的gci()方法用于获取当前可着色的美术师。
用法:matplotlib.pyplot.gci()
参数:此方法不接受任何参数。
返回:此方法返回当前可着色的艺术家。
以下示例说明了matplotlib.pyplot中的matplotlib.pyplot.gci()函数:
范例1:
# Implementation of matplotlib function
import matplotlib.pyplot as plt
import numpy as np
import matplotlib.gridspec as gridspec
from mpl_toolkits.axes_grid1 import make_axes_locatable


plt.close('all')
arr = np.arange(100).reshape((10, 10))
fig = plt.figure(figsize =(4, 4))
im = plt.imshow(arr,
                interpolation ="none",
                cmap ="plasma")

divider = make_axes_locatable(plt.gca())
cax = divider.append_axes("left",
                          "15 %",
                          pad ="30 %")

plt.colorbar(im, cax = cax)

print("The current colorable artist is:")
print(plt.gci())

fig.suptitle('matplotlib.pyplot.gci() function \
Example\n\n', fontweight ="bold")

plt.show()
输出:
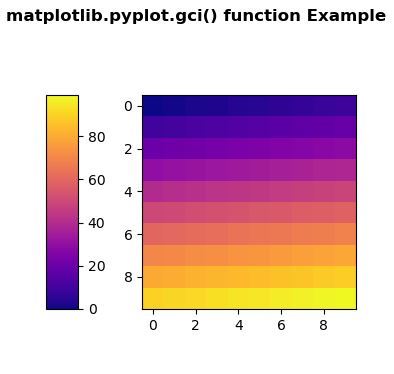
The current colorable artist is:
AxesImage(50, 44;310x308)
范例2:
# Implementation of matplotlib function
import matplotlib.pyplot as plt
from scipy import sin, cos


fig, ax = plt.subplots(2, 1)
x = [1, 2, 3, 4, 5, 6, 7, 8, 9]

y1 = sin(x)
y2 = cos(x)

plt.sca(ax[0])
plt.plot(x, y1)

plt.sca(ax[1])
plt.plot(x, y2)

print("The current colorable artist is:")
print(plt.gci())

fig.suptitle('matplotlib.pyplot.gci() function \
Example\n\n', fontweight ="bold")

plt.show()
输出:
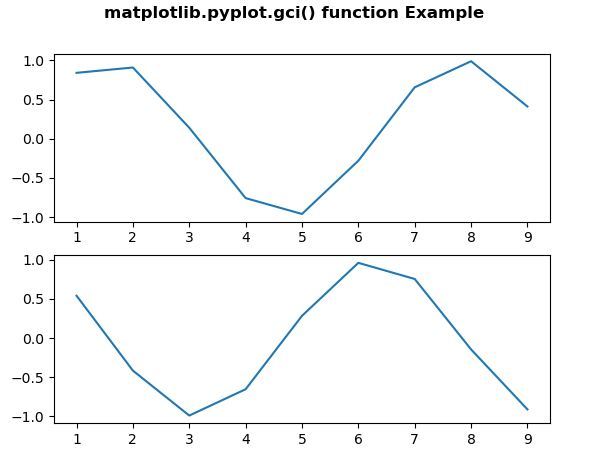
The current colorable artist is:
None
注:本文由纯净天空筛选整理自SHUBHAMSINGH10大神的英文原创作品 Matplotlib.pyplot.gci() in Python。非经特殊声明,原始代码版权归原作者所有,本译文未经允许或授权,请勿转载或复制。