Matplotlib是Python中的一個庫,它是數字的-NumPy庫的數學擴展。 Pyplot是Matplotlib模塊的基於狀態的接口,該模塊提供了MATLAB-like接口。可在Pyplot中使用的各種圖線圖,輪廓圖,直方圖,散點圖,3D圖等。
matplotlib.pyplot.gci()方法
matplotlib庫的pyplot模塊中的gci()方法用於獲取當前可著色的美術師。
用法:matplotlib.pyplot.gci()
參數:此方法不接受任何參數。
返回:此方法返回當前可著色的藝術家。
以下示例說明了matplotlib.pyplot中的matplotlib.pyplot.gci()函數:
範例1:
# Implementation of matplotlib function
import matplotlib.pyplot as plt
import numpy as np
import matplotlib.gridspec as gridspec
from mpl_toolkits.axes_grid1 import make_axes_locatable


plt.close('all')
arr = np.arange(100).reshape((10, 10))
fig = plt.figure(figsize =(4, 4))
im = plt.imshow(arr,
                interpolation ="none",
                cmap ="plasma")

divider = make_axes_locatable(plt.gca())
cax = divider.append_axes("left",
                          "15 %",
                          pad ="30 %")

plt.colorbar(im, cax = cax)

print("The current colorable artist is:")
print(plt.gci())

fig.suptitle('matplotlib.pyplot.gci() function \
Example\n\n', fontweight ="bold")

plt.show()
輸出:
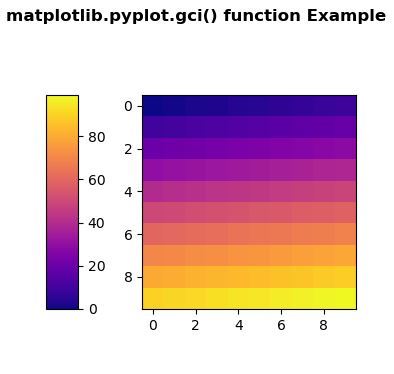
The current colorable artist is:
AxesImage(50, 44;310x308)
範例2:
# Implementation of matplotlib function
import matplotlib.pyplot as plt
from scipy import sin, cos


fig, ax = plt.subplots(2, 1)
x = [1, 2, 3, 4, 5, 6, 7, 8, 9]

y1 = sin(x)
y2 = cos(x)

plt.sca(ax[0])
plt.plot(x, y1)

plt.sca(ax[1])
plt.plot(x, y2)

print("The current colorable artist is:")
print(plt.gci())

fig.suptitle('matplotlib.pyplot.gci() function \
Example\n\n', fontweight ="bold")

plt.show()
輸出:
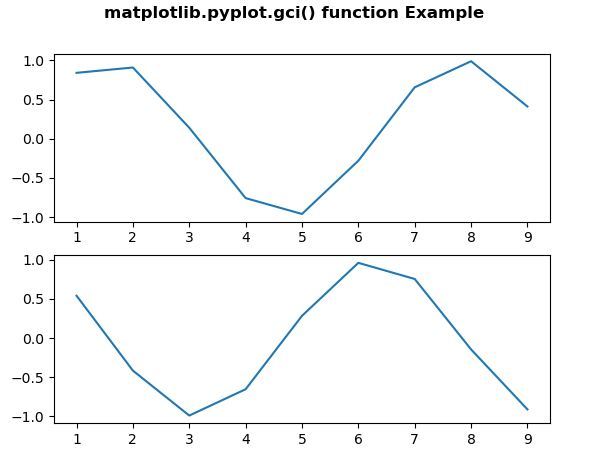
The current colorable artist is:
None
注:本文由純淨天空篩選整理自SHUBHAMSINGH10大神的英文原創作品 Matplotlib.pyplot.gci() in Python。非經特殊聲明,原始代碼版權歸原作者所有,本譯文未經允許或授權,請勿轉載或複製。