Matplotlib是Python中的一个库,它是数字的-NumPy库的数学扩展。 Pyplot是Matplotlib模块的基于状态的接口,该模块提供了MATLAB-like接口。在Pyplot中可以使用各种图,例如线图,轮廓图,直方图,散点图,3D图等。
matplotlib.pyplot.rcdefaults()函数
matplotlib库的pyplot模块中的rcdefaults()函数用于从Matplotlib的内部默认样式中还原rc参数。
用法: matplotlib.pyplot.rcdefaults()
参数:此方法不接受任何参数。
返回:此方法不返回任何值。
以下示例说明了matplotlib.pyplot中的matplotlib.pyplot.rcdefaults()函数:
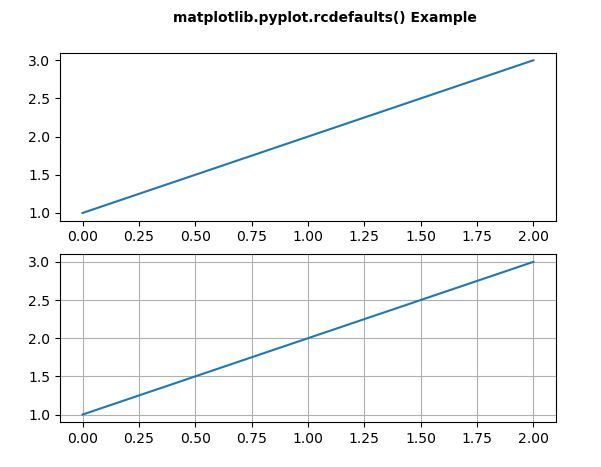
范例1:
# implementation of the matplotlib function
import matplotlib.pyplot as plt

plt.subplot(211)
plt.rc('font', weight ='bold')
plt.rc('xtick.major', size = 5, pad = 7)
plt.rc('xtick', labelsize = 15)
plt.plot([1, 2, 3])

plt.text(0.4, 3.5, 'matplotlib.pyplot.rcdefaults() Example')

plt.rcdefaults()
plt.subplot(212)
plt.plot([1, 2, 3])
plt.grid(True)

plt.show()
输出:
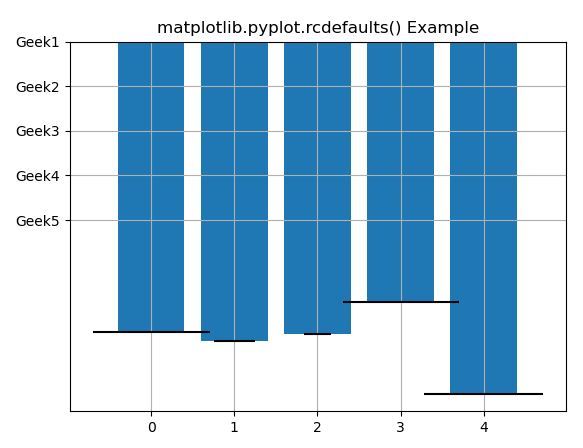
范例2:
# implementation of the matplotlib function
import matplotlib.pyplot as plt
import numpy as np

np.random.seed(19680801)

plt.rcdefaults()
fig, ax = plt.subplots()

people = ('Geek1', 'Geek2', 'Geek3', 'Geek4', 'Geek5')
y_pos = np.arange(len(people))
performance = 3 + 5 * np.random.rand(len(people))
error = np.random.rand(len(people))

ax.bar(y_pos, performance, xerr = error, align ='center')
ax.set_yticks(y_pos)
ax.set_yticklabels(people)
ax.invert_yaxis()
plt.grid(True)

plt.title('matplotlib.pyplot.rcdefaults() Example')
plt.show()
输出:
注:本文由纯净天空筛选整理自SHUBHAMSINGH10大神的英文原创作品 Matplotlib.pyplot.rcdefaults() in Python。非经特殊声明,原始代码版权归原作者所有,本译文未经允许或授权,请勿转载或复制。