Matplotlib是Python中令人惊叹的可视化库,用于二维阵列图。 Matplotlib是一个基于NumPy数组的多平台数据可视化库,旨在与更广泛的SciPy堆栈配合使用。
matplotlib.pyplot.gcf()
matplotlib.pyplot.gcf()主要用于获取当前数字。如果没有可用的当前数字,则借助figure()函数。
用法:
matplotlib.pyplot.gcf()
范例1:
import numpy as np
from matplotlib.backends.backend_agg import FigureCanvasAgg
import matplotlib.pyplot as plot
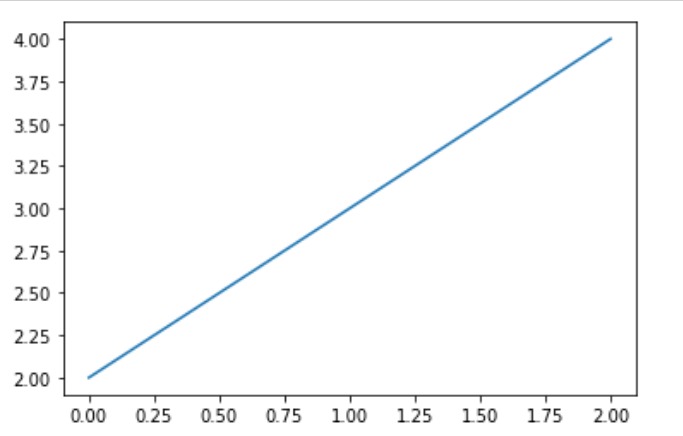
plot.plot([2, 3, 4])
# implementation of the
# matplotlib.pyplot.gcf()
# function
figure = plot.gcf().canvas
ag = figure.switch_backends(FigureCanvasAgg)
ag.draw()
A = np.asarray(ag.buffer_rgba())
# Pass off to PIL.
from PIL import Image
img = Image.fromarray(A)
# show image
img.show()输出:
范例2:
import matplotlib.pyplot as plt
from matplotlib.tri import Triangulation
from matplotlib.patches import Polygon
import numpy as np
# helper function to update
# the polygon
def polygon_updater(tr):
if tr == -1:
points = [0, 0, 0]
else:
points = tri.triangles[tr]
x_axis = tri.x[points]
y_axis = tri.y[points]
polygon.set_xy(np.column_stack([x_axis, y_axis]))
# helper function to set the motion
# of polygon
def motion_handler(e):
if e.inaxes is None:
tr = -1
else:
tr = trifinder(e.xdata, e.ydata)
polygon_updater(tr)
e.canvas.draw()
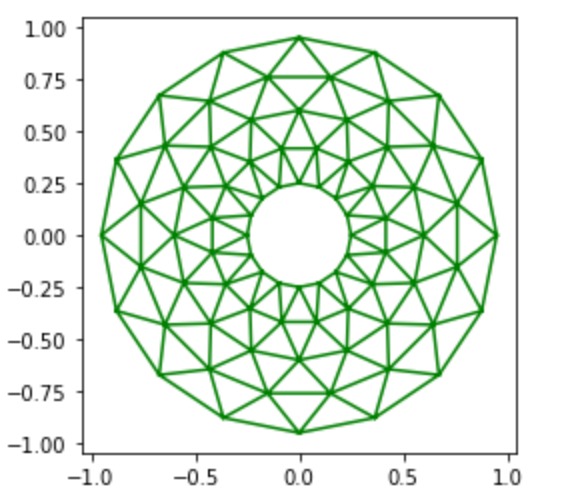
# Making the Triangulation.
all_angles = 16
all_radii = 5
minimum_radii = 0.25
radii = np.linspace(minimum_radii, 0.95, all_radii)
triangulation_angles = np.linspace(0, 2 * np.pi,
all_angles,
endpoint = False)
triangulation_angles = np.repeat(triangulation_angles[...,
np.newaxis],
all_radii, axis = 1)
triangulation_angles[:, 1::2] += np.pi / all_angles
a = (radii * np.cos(triangulation_angles)).flatten()
b = (radii * np.sin(triangulation_angles)).flatten()
tri = Triangulation(a, b)
tri.set_mask(np.hypot(a[tri.triangles].mean(axis = 1),
b[tri.triangles].mean(axis = 1))
< minimum_radii)
# Useing TriFinder object from
# Triangulation
trifinder = tri.get_trifinder()
# Setting up the plot and the callbacks.
plt.subplot(111, aspect ='equal')
plt.triplot(tri, 'g-')
# dummy data for (x-axis, y-axis)
polygon = Polygon([[0, 0], [0, 0]],
facecolor ='b')
polygon_updater(-1)
plt.gca().add_patch(polygon)
# implementation of the matplotlib.pyplot.gcf() function
plt.gcf().canvas.mpl_connect('motion_notification',
motion_handler)
plt.show()输出:
相关用法
注:本文由纯净天空筛选整理自RajuKumar19大神的英文原创作品 Matplotlib.pyplot.gcf() in Python。非经特殊声明,原始代码版权归原作者所有,本译文未经允许或授权,请勿转载或复制。