本文簡要介紹 python 語言中 scipy.stats.levene 的用法。
用法:
scipy.stats.levene(*samples, center='median', proportiontocut=0.05)#對等方差執行 Levene 檢驗。
Levene 檢驗檢驗所有輸入樣本均來自方差相等的總體的原假設。在與正態性存在顯著偏差的情況下,Levene 檢驗是 Bartlett 檢驗
bartlett的替代方案。- sample1, sample2, …: array_like
樣本數據,可能具有不同的長度。隻接受一維樣本。
- center: {‘mean’, ‘median’, ‘trimmed’},可選
在測試中使用數據的哪個函數。默認值為‘median’。
- proportiontocut: 浮點數,可選
什麽時候中央是‘trimmed’,這給出了從每一端切割的數據點的比例。 (看scipy.stats.trim_mean.) 默認值為 0.05。
- statistic: 浮點數
檢驗統計量。
- pvalue: 浮點數
檢驗的 p 值。
參數 ::
返回 ::
注意:
Levene 測試的三種變體是可能的。可能性及其推薦的用法是:
‘median’ : Recommended for skewed (non-normal) distributions>
‘mean’ : Recommended for symmetric, moderate-tailed distributions.
‘trimmed’ : Recommended for heavy-tailed distributions.
使用均值的測試版本是在 Levene 的原始文章([2])中提出的,而 Brown 和 Forsythe([3])研究了中位數和修剪後的均值,有時也稱為Brown-Forsythe 測試。
參考:
[2]Levene, H. (1960)。在對概率和統計的貢獻:紀念哈羅德·霍特林的論文,I. Olkin 等人。 eds.,斯坦福大學出版社,第 278-292 頁。
[3]Brown, M. B. 和 Forsythe, A. B. (1974),美國統計協會雜誌,69, 364-367
[4]C.I. BLISS (1952),生物測定統計:特別參考維生素,第 499-503 頁,DOI:10.1016/C2013-0-12584-6。
[5]B. Phipson 和 G. K. Smyth。 “排列 P 值不應該為零:隨機抽取排列時計算精確的 P 值。”遺傳學和分子生物學中的統計應用 9.1 (2010)。
[6]勒德布魯克,J. 和達德利,H. (1998)。為什麽排列檢驗在生物醫學研究中優於 t 和 F 檢驗。 《美國統計學家》,52(2), 127-132。
例子:
文獻[4]研究了維生素C對豚鼠牙齒生長的影響。在一項對照研究中,60 名受試者被分為小劑量組、中劑量組和大劑量組,分別每天服用 0.5、1.0 和 2.0 毫克維生素 C。 42天後,測量牙齒的生長情況。
下麵的
small_dose、medium_dose和large_dose數組記錄了三組的牙齒生長測量值(以微米為單位)。>>> import numpy as np >>> small_dose = np.array([ ... 4.2, 11.5, 7.3, 5.8, 6.4, 10, 11.2, 11.2, 5.2, 7, ... 15.2, 21.5, 17.6, 9.7, 14.5, 10, 8.2, 9.4, 16.5, 9.7 ... ]) >>> medium_dose = np.array([ ... 16.5, 16.5, 15.2, 17.3, 22.5, 17.3, 13.6, 14.5, 18.8, 15.5, ... 19.7, 23.3, 23.6, 26.4, 20, 25.2, 25.8, 21.2, 14.5, 27.3 ... ]) >>> large_dose = np.array([ ... 23.6, 18.5, 33.9, 25.5, 26.4, 32.5, 26.7, 21.5, 23.3, 29.5, ... 25.5, 26.4, 22.4, 24.5, 24.8, 30.9, 26.4, 27.3, 29.4, 23 ... ])levene統計量對樣本之間的方差差異敏感。>>> from scipy import stats >>> res = stats.levene(small_dose, medium_dose, large_dose) >>> res.statistic 0.6457341109631506當方差差異較大時,統計量的值往往較高。
我們可以通過將統計量的觀測值與零分布進行比較來測試組之間的方差不等性:零分布是在三組總體方差相等的零假設下得出的統計值的分布。
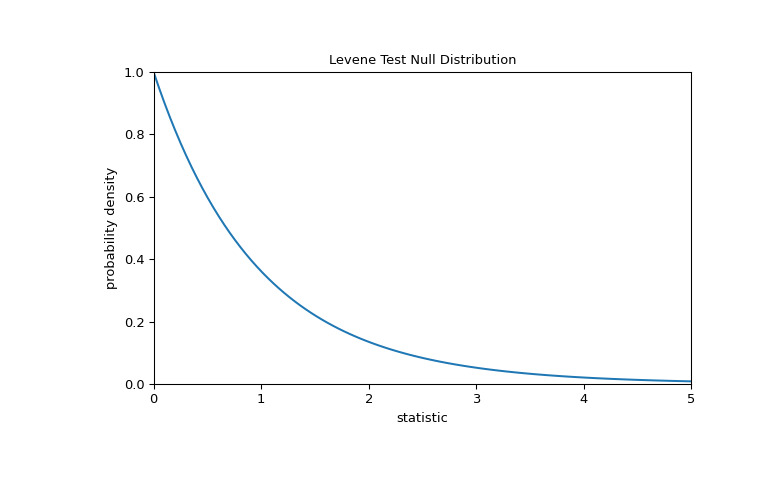
對於此測試,零分布遵循 F 分布,如下所示。
>>> import matplotlib.pyplot as plt
>>> k, n = 3, 60   # number of samples, total number of observations
>>> dist = stats.f(dfn=k-1, dfd=n-k)
>>> val = np.linspace(0, 5, 100)
>>> pdf = dist.pdf(val)
>>> fig, ax = plt.subplots(figsize=(8, 5))
>>> def plot(ax):  # we'll re-use this
...     ax.plot(val, pdf, color='C0')
...     ax.set_title("Levene Test Null Distribution")
...     ax.set_xlabel("statistic")
...     ax.set_ylabel("probability density")
...     ax.set_xlim(0, 5)
...     ax.set_ylim(0, 1)
>>> plot(ax)
>>> plt.show()
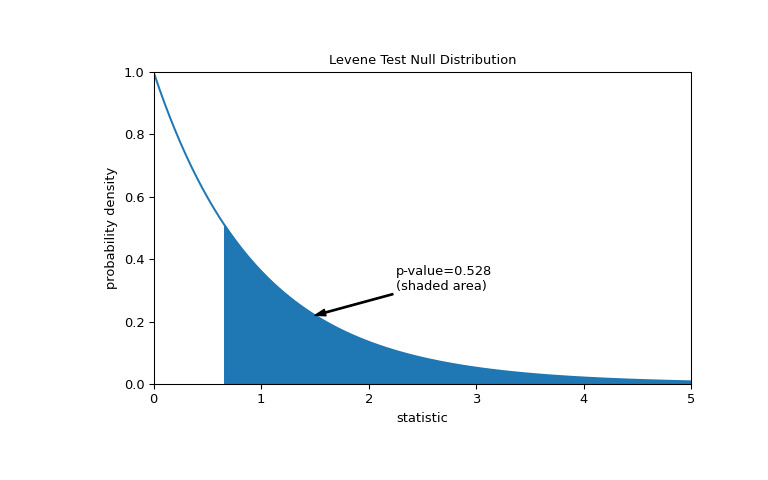
比較通過 p 值進行量化:零分布中大於或等於統計觀測值的值的比例。
>>> fig, ax = plt.subplots(figsize=(8, 5))
>>> plot(ax)
>>> pvalue = dist.sf(res.statistic)
>>> annotation = (f'p-value={pvalue:.3f}\n(shaded area)')
>>> props = dict(facecolor='black', width=1, headwidth=5, headlength=8)
>>> _ = ax.annotate(annotation, (1.5, 0.22), (2.25, 0.3), arrowprops=props)
>>> i = val >= res.statistic
>>> ax.fill_between(val[i], y1=0, y2=pdf[i], color='C0')
>>> plt.show()
>>> res.pvalue
0.5280694573759905
如果 p 值為 “small” - 也就是說,如果從具有相同方差的分布中采樣數據產生統計量極值的概率較低 - 這可以作為反對零假設的證據另一種選擇:各組的方差不相等。注意:
反之則不成立;也就是說,檢驗不用於為原假設提供證據。
將被視為 “small” 的值的閾值是在分析數據之前應做出的選擇 [5],同時考慮誤報(錯誤地拒絕原假設)和漏報(未能拒絕假設)的風險。錯誤的原假設)。
p 值小並不能證明效果大;相反,它們隻能為 “significant” 效應提供證據,這意味著它們不太可能在原假設下發生。
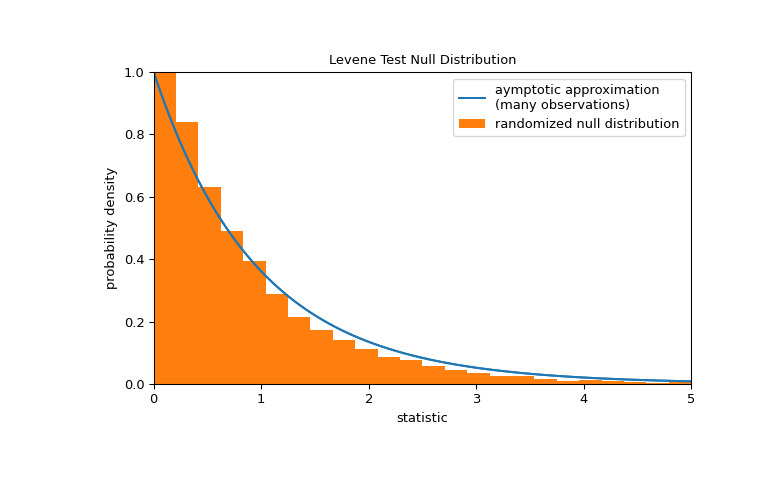
請注意,F 分布提供了零分布的漸近近似。對於小樣本,執行排列檢驗可能更合適:在所有三個樣本均來自同一總體的零假設下,每個測量值在三個樣本中的任何一個中觀察到的可能性相同。因此,我們可以通過計算將觀測值劃分為三個樣本的許多 randomly-generated 下的統計量來形成隨機零分布。
>>> def statistic(*samples):
...     return stats.levene(*samples).statistic
>>> ref = stats.permutation_test(
...     (small_dose, medium_dose, large_dose), statistic,
...     permutation_type='independent', alternative='greater'
... )
>>> fig, ax = plt.subplots(figsize=(8, 5))
>>> plot(ax)
>>> bins = np.linspace(0, 5, 25)
>>> ax.hist(
...     ref.null_distribution, bins=bins, density=True, facecolor="C1"
... )
>>> ax.legend(['aymptotic approximation\n(many observations)',
...            'randomized null distribution'])
>>> plot(ax)
>>> plt.show()
>>> ref.pvalue  # randomized test p-value
0.4559  # may vary
請注意,此處計算的 p 值與上麵
levene返回的漸近近似值之間存在顯著差異。從排列檢驗中嚴格得出的統計推論是有限的;盡管如此,在許多情況下它們可能是首選方法[6]。以下是另一個一般示例,其中原假設將被拒絕。
測試列表 a、b 和 c 是否來自具有相等方差的總體。
>>> a = [8.88, 9.12, 9.04, 8.98, 9.00, 9.08, 9.01, 8.85, 9.06, 8.99]
>>> b = [8.88, 8.95, 9.29, 9.44, 9.15, 9.58, 8.36, 9.18, 8.67, 9.05]
>>> c = [8.95, 9.12, 8.95, 8.85, 9.03, 8.84, 9.07, 8.98, 8.86, 8.98]
>>> stat, p = stats.levene(a, b, c)
>>> p
0.002431505967249681
小 p 值表明總體方差不相等。
這並不奇怪,因為 b 的樣本方差遠大於 a 和 c 的樣本方差:
>>> [np.var(x, ddof=1) for x in [a, b, c]]
[0.007054444444444413, 0.13073888888888888, 0.008890000000000002]
相關用法
- Python SciPy stats.levy_stable用法及代碼示例
- Python SciPy stats.levy_l用法及代碼示例
- Python SciPy stats.levy用法及代碼示例
- Python SciPy stats.lognorm用法及代碼示例
- Python SciPy stats.logrank用法及代碼示例
- Python SciPy stats.loglaplace用法及代碼示例
- Python SciPy stats.laplace用法及代碼示例
- Python SciPy stats.linregress用法及代碼示例
- Python SciPy stats.loguniform用法及代碼示例
- Python SciPy stats.logistic用法及代碼示例
- Python SciPy stats.logser用法及代碼示例
- Python SciPy stats.loggamma用法及代碼示例
- Python SciPy stats.lomax用法及代碼示例
- Python SciPy stats.laplace_asymmetric用法及代碼示例
- Python SciPy stats.anderson用法及代碼示例
- Python SciPy stats.iqr用法及代碼示例
- Python SciPy stats.genpareto用法及代碼示例
- Python SciPy stats.skewnorm用法及代碼示例
- Python SciPy stats.cosine用法及代碼示例
- Python SciPy stats.norminvgauss用法及代碼示例
- Python SciPy stats.directional_stats用法及代碼示例
- Python SciPy stats.invwishart用法及代碼示例
- Python SciPy stats.bartlett用法及代碼示例
- Python SciPy stats.page_trend_test用法及代碼示例
- Python SciPy stats.itemfreq用法及代碼示例
注:本文由純淨天空篩選整理自scipy.org大神的英文原創作品 scipy.stats.levene。非經特殊聲明,原始代碼版權歸原作者所有,本譯文未經允許或授權,請勿轉載或複製。
