本文簡要介紹 python 語言中 scipy.stats.genlogistic 的用法。
用法:
scipy.stats.genlogistic = <scipy.stats._continuous_distns.genlogistic_gen object>#廣義邏輯連續隨機變量。
作為
rv_continuous類的實例,genlogistic對象從它繼承了一組通用方法(完整列表見下文),並用特定於此特定發行版的詳細信息來完成它們。注意:
genlogistic的概率密度函數為:對於真正的 和 。在文獻中,可以找到邏輯分布的不同概括。這是根據 [1] 的 1 類廣義邏輯分布。它也稱為skew-logistic 分布 [2]。
genlogistic將c作為 的形狀參數。上麵的概率密度在“standardized” 表格中定義。要移動和/或縮放分布,請使用
loc和scale參數。具體來說,genlogistic.pdf(x, c, loc, scale)等同於genlogistic.pdf(y, c) / scale和y = (x - loc) / scale。請注意,移動分布的位置不會使其成為“noncentral” 分布;某些分布的非中心概括可在單獨的類中獲得。參考:
[1]約翰遜等人。 “Continuous Univariate Distributions”,第 2 卷,Wiley。 1995年。
[2]“Generalized Logistic Distribution”,維基百科,https://en.wikipedia.org/wiki/Generalized_logistic_distribution
例子:
>>> import numpy as np
>>> from scipy.stats import genlogistic
>>> import matplotlib.pyplot as plt
>>> fig, ax = plt.subplots(1, 1)
計算前四個時刻:
>>> c = 0.412
>>> mean, var, skew, kurt = genlogistic.stats(c, moments='mvsk')
顯示概率密度函數(
pdf):>>> x = np.linspace(genlogistic.ppf(0.01, c), ... genlogistic.ppf(0.99, c), 100) >>> ax.plot(x, genlogistic.pdf(x, c), ... 'r-', lw=5, alpha=0.6, label='genlogistic pdf')或者,可以調用分布對象(作為函數)來固定形狀、位置和比例參數。這將返回一個 “frozen” RV 對象,其中包含固定的給定參數。
凍結分布並顯示凍結的
pdf:>>> rv = genlogistic(c) >>> ax.plot(x, rv.pdf(x), 'k-', lw=2, label='frozen pdf')檢查
cdf和ppf的準確性:>>> vals = genlogistic.ppf([0.001, 0.5, 0.999], c) >>> np.allclose([0.001, 0.5, 0.999], genlogistic.cdf(vals, c)) True生成隨機數:
>>> r = genlogistic.rvs(c, size=1000)並比較直方圖:
>>> ax.hist(r, density=True, bins='auto', histtype='stepfilled', alpha=0.2)
>>> ax.set_xlim([x[0], x[-1]])
>>> ax.legend(loc='best', frameon=False)
>>> plt.show()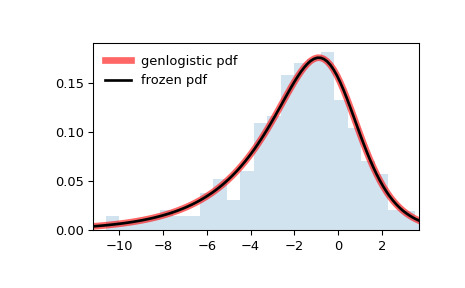
相關用法
- Python SciPy stats.genpareto用法及代碼示例
- Python SciPy stats.gennorm用法及代碼示例
- Python SciPy stats.genhalflogistic用法及代碼示例
- Python SciPy stats.genexpon用法及代碼示例
- Python SciPy stats.genhyperbolic用法及代碼示例
- Python SciPy stats.gengamma用法及代碼示例
- Python SciPy stats.genextreme用法及代碼示例
- Python SciPy stats.geninvgauss用法及代碼示例
- Python SciPy stats.geom用法及代碼示例
- Python SciPy stats.gumbel_l用法及代碼示例
- Python SciPy stats.gzscore用法及代碼示例
- Python SciPy stats.gompertz用法及代碼示例
- Python SciPy stats.gibrat用法及代碼示例
- Python SciPy stats.gmean用法及代碼示例
- Python SciPy stats.gamma用法及代碼示例
- Python scipy.stats.gilbrat用法及代碼示例
- Python SciPy stats.gstd用法及代碼示例
- Python SciPy stats.gaussian_kde用法及代碼示例
- Python SciPy stats.gumbel_r用法及代碼示例
- Python SciPy stats.gausshyper用法及代碼示例
- Python SciPy stats.goodness_of_fit用法及代碼示例
- Python SciPy stats.anderson用法及代碼示例
- Python SciPy stats.iqr用法及代碼示例
- Python SciPy stats.skewnorm用法及代碼示例
- Python SciPy stats.cosine用法及代碼示例
注:本文由純淨天空篩選整理自scipy.org大神的英文原創作品 scipy.stats.genlogistic。非經特殊聲明,原始代碼版權歸原作者所有,本譯文未經允許或授權,請勿轉載或複製。