分類器的概率校準簡介
執行分類時,您通常不僅要預測類別標簽,還要預測相關的概率。該概率使可以認為是預測結果的置信度(confidence coefficient)。但是,並非所有分類器都提供校正好的概率,其中一些是over-confident,而另一些是under-confident。
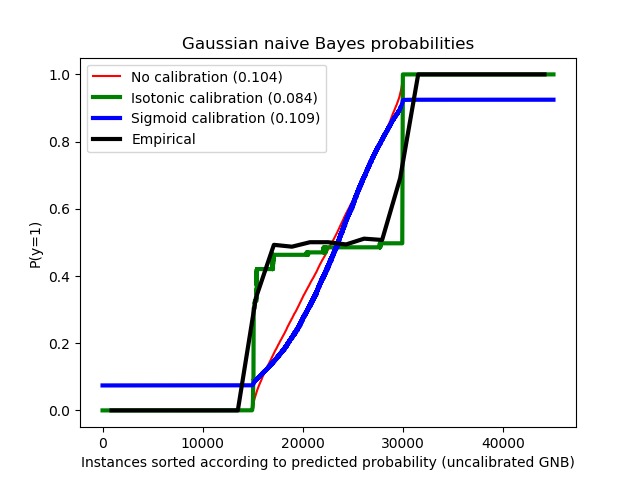
因此,通常期望對預測概率進行單獨的校準作為後處理。本示例說明了兩種不同的校準方法,並使用Brier分數評估了返回的概率的質量(Brier分數詳細見https://en.wikipedia.org/wiki/Brier_score,簡單來說,Brier分數可以被認為是對一組概率預測的“校準”的量度,或者稱為“ 成本函數 ”,這一組概率對應的情況必須互斥,並且概率之和必須為1.)。
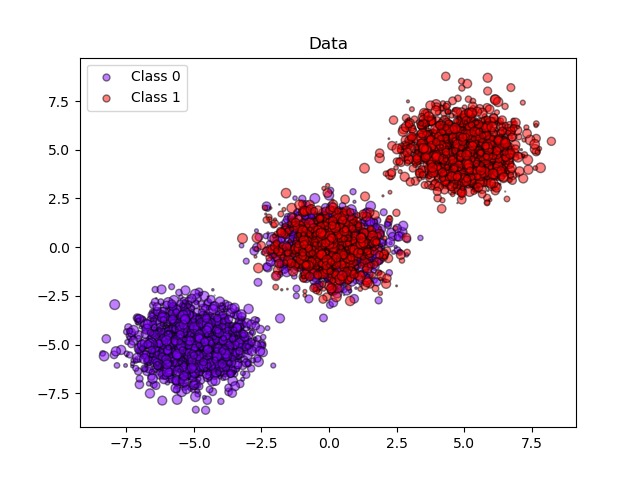
示例中使用高斯樸素貝葉斯分類器估計概率,比較了未經校準、S型校準和非參數等滲校準三種情況。可以觀察到,隻有非參數模型能夠提供概率校準,該校準返回屬於中間集群且帶有異類標記的大多數樣本的概率接近預期的0.5。這樣可以顯著提高Brier得分。
代碼實現[Python]
# -*- coding: utf-8 -*-
print(__doc__)

# Author: Mathieu Blondel
#         Alexandre Gramfort
#         Balazs Kegl
#         Jan Hendrik Metzen
# License: BSD Style.

import numpy as np
import matplotlib.pyplot as plt
from matplotlib import cm

from sklearn.datasets import make_blobs
from sklearn.naive_bayes import GaussianNB
from sklearn.metrics import brier_score_loss
from sklearn.calibration import CalibratedClassifierCV
from sklearn.model_selection import train_test_split


n_samples = 50000
n_bins = 3  # use 3 bins for calibration_curve as we have 3 clusters here

# Generate 3 blobs with 2 classes where the second blob contains
# half positive samples and half negative samples. Probability in this
# blob is therefore 0.5.
centers = [(-5, -5), (0, 0), (5, 5)]
X, y = make_blobs(n_samples=n_samples, n_features=2, cluster_std=1.0,
                  centers=centers, shuffle=False, random_state=42)

y[:n_samples // 2] = 0
y[n_samples // 2:] = 1
sample_weight = np.random.RandomState(42).rand(y.shape[0])

# 為校準切分訓練集和測試集
X_train, X_test, y_train, y_test, sw_train, sw_test = \
    train_test_split(X, y, sample_weight, test_size=0.9, random_state=42)

# 未校準的高斯樸素貝葉斯
clf = GaussianNB()
clf.fit(X_train, y_train)  # GaussianNB itself does not support sample-weights
prob_pos_clf = clf.predict_proba(X_test)[:, 1]

# 使用等滲校準的高斯樸素貝葉斯
clf_isotonic = CalibratedClassifierCV(clf, cv=2, method='isotonic')
clf_isotonic.fit(X_train, y_train, sw_train)
prob_pos_isotonic = clf_isotonic.predict_proba(X_test)[:, 1]

# 使用sigmoid校準(S校準)的高斯樸素貝葉斯
clf_sigmoid = CalibratedClassifierCV(clf, cv=2, method='sigmoid')
clf_sigmoid.fit(X_train, y_train, sw_train)
prob_pos_sigmoid = clf_sigmoid.predict_proba(X_test)[:, 1]

print("Brier scores: (the smaller the better)")

clf_score = brier_score_loss(y_test, prob_pos_clf, sw_test)
print("No calibration: %1.3f" % clf_score)

clf_isotonic_score = brier_score_loss(y_test, prob_pos_isotonic, sw_test)
print("With isotonic calibration: %1.3f" % clf_isotonic_score)

clf_sigmoid_score = brier_score_loss(y_test, prob_pos_sigmoid, sw_test)
print("With sigmoid calibration: %1.3f" % clf_sigmoid_score)

# #############################################################################
# 繪製數據和預測的概率
plt.figure()
y_unique = np.unique(y)
colors = cm.rainbow(np.linspace(0.0, 1.0, y_unique.size))
for this_y, color in zip(y_unique, colors):
    this_X = X_train[y_train == this_y]
    this_sw = sw_train[y_train == this_y]
    plt.scatter(this_X[:, 0], this_X[:, 1], s=this_sw * 50,
                c=color[np.newaxis, :],
                alpha=0.5, edgecolor='k',
                label="Class %s" % this_y)
plt.legend(loc="best")
plt.title("Data")

plt.figure()
order = np.lexsort((prob_pos_clf, ))
plt.plot(prob_pos_clf[order], 'r', label='No calibration (%1.3f)' % clf_score)
plt.plot(prob_pos_isotonic[order], 'g', linewidth=3,
         label='Isotonic calibration (%1.3f)' % clf_isotonic_score)
plt.plot(prob_pos_sigmoid[order], 'b', linewidth=3,
         label='Sigmoid calibration (%1.3f)' % clf_sigmoid_score)
plt.plot(np.linspace(0, y_test.size, 51)[1::2],
         y_test[order].reshape(25, -1).mean(1),
         'k', linewidth=3, label=r'Empirical')
plt.ylim([-0.05, 1.05])
plt.xlabel("Instances sorted according to predicted probability "
           "(uncalibrated GNB)")
plt.ylabel("P(y=1)")
plt.legend(loc="upper left")
plt.title("Gaussian naive Bayes probabilities")

plt.show()
代碼執行
代碼運行時間大約:0分0.108秒。
運行代碼輸出的文本內容如下:
Brier scores: (the smaller the better)
No calibration: 0.104
With isotonic calibration: 0.084
With sigmoid calibration: 0.109
運行代碼輸出的圖片內容如下:


源碼下載
- Python版源碼文件: plot_calibration.py
- Jupyter Notebook版源碼文件: plot_calibration.ipynb
