pweibull()R语言中的函数用于计算威布尔分布的累积分布函数的值。它还绘制了累积威布尔函数的密度图。
用法: pweibull(x, shape)
参数:
x:数字向量
shape:形状参数
范例1:
# R Program to compute
# Cumulative Weibull Density

# Creating a sequence of x-values
x <- seq(-5, 15, by = 1)

# Calling pweibull() Function
y <- pweibull(x, shape = 0.2)
y
输出:
 [1] 0.0000000 0.0000000 0.0000000 0.0000000 0.0000000 0.0000000 0.6321206
 [8] 0.6829508 0.7122695 0.7327332 0.7483534 0.7609229 0.7713981 0.7803493
[15] 0.7881434 0.7950303 0.8011877 0.8067464 0.8118052 0.8164408 0.8207138
范例2:
# R Program to compute
# Cumulative Weibull Density

# Creating a sequence of x-values
x <- seq(-5, 15, by = 0.2)

# Calling pweibull() Function
y <- pweibull(x, shape = 0.5)

# Plot a graph
plot(y)
输出: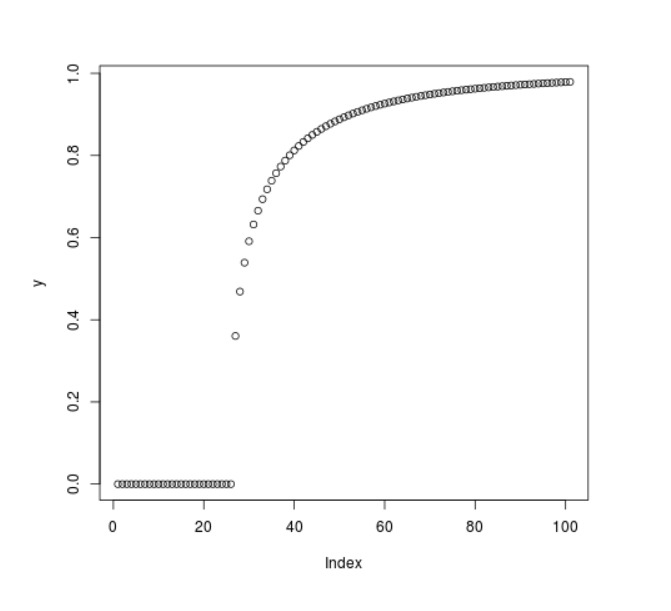
相关用法
- R语言 dweibull()用法及代码示例
- R语言 rweibull()用法及代码示例
- R语言 pchisq()用法及代码示例
- R语言 pcauchy()用法及代码示例
- R语言 plogis()用法及代码示例
- R语言 plnorm()用法及代码示例
- R语言 pnbinom()用法及代码示例
- R语言 ppois()用法及代码示例
- R语言 qweibull()用法及代码示例
- R语言 ecdf()用法及代码示例
- R语言 pf()用法及代码示例
- R语言 density()用法及代码示例
- R语言 qchisq()用法及代码示例
- R语言 dpois()用法及代码示例
- R语言 df()用法及代码示例
- R语言 dunif()用法及代码示例
- R语言 rf()用法及代码示例
- R语言 dchisq()用法及代码示例
- R语言 dcauchy()用法及代码示例
- R语言 rchisq()用法及代码示例
- R语言 dlogis()用法及代码示例
- R语言 rlnorm()用法及代码示例
注:本文由纯净天空筛选整理自nidhi_biet大神的英文原创作品 Compute the Value of Cumulative Weibull Density in R Programming – pweibull() Function。非经特殊声明,原始代码版权归原作者所有,本译文未经允许或授权,请勿转载或复制。