pcauchy()R语言中的函数用于计算累积柯西密度。它还创建了柯西累积分布的密度图。
用法: pcauchy(vec, scale)
参数:
vec:x-values 用于柯西函数
scale:绘图比例
范例1:
# R Program to compute cumulative cauchy density

# Creating vector for x-values
x <- seq(0, 2, by = 0.2)

# Apply pcauchy() Function
y <- pcauchy(x, scale = 5)
y
输出:
 [1] 0.5000000 0.5127256 0.5254107 0.5380154 0.5505015 0.5628330 0.5749763
 [8] 0.5869014 0.5985815 0.6099938 0.6211189
范例2:
# R Program to compute cumulative cauchy density

# Creating vector for x-values
x <- seq(0, 2, by = 0.2)

# Apply pcauchy() Function
y <- pcauchy(x, scale = 5)

# Plotting a graph
plot(y)
输出: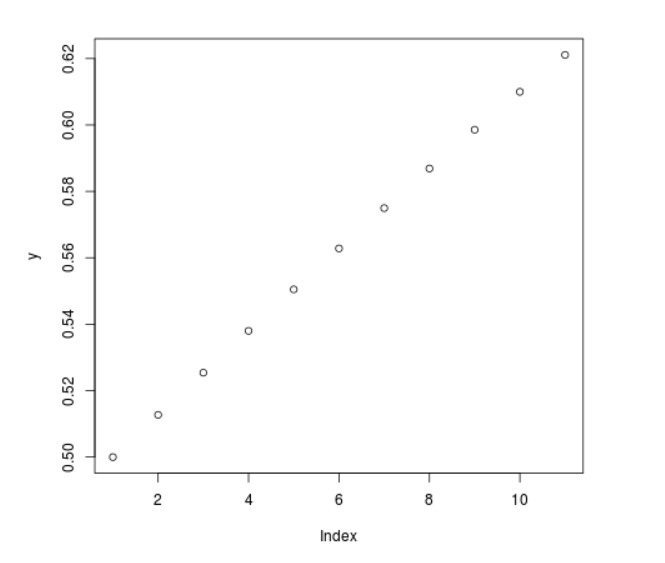
相关用法
- R语言 dcauchy()用法及代码示例
- R语言 rcauchy()用法及代码示例
- R语言 pchisq()用法及代码示例
- R语言 plogis()用法及代码示例
- R语言 plnorm()用法及代码示例
- R语言 pnbinom()用法及代码示例
- R语言 ppois()用法及代码示例
- R语言 pweibull()用法及代码示例
- R语言 qcauchy()用法及代码示例
- R语言 density()用法及代码示例
- R语言 ecdf()用法及代码示例
- R语言 pf()用法及代码示例
- R语言 dunif()用法及代码示例
- R语言 rf()用法及代码示例
- R语言 dchisq()用法及代码示例
- R语言 rchisq()用法及代码示例
- R语言 dlogis()用法及代码示例
- R语言 rlnorm()用法及代码示例
- R语言 qchisq()用法及代码示例
- R语言 dlnorm()用法及代码示例
- R语言 rlogis()用法及代码示例
- R语言 dnbinom()用法及代码示例
注:本文由纯净天空筛选整理自nidhi_biet大神的英文原创作品 Compute Cumulative Cauchy Density in R Programming – pcauchy() Function。非经特殊声明,原始代码版权归原作者所有,本译文未经允许或授权,请勿转载或复制。