本文簡要介紹 python 語言中 scipy.stats.vonmises_fisher 的用法。
用法:
scipy.stats.vonmises_fisher = <scipy.stats._multivariate.vonmises_fisher_gen object>#馮 Mises-Fisher 變量。
mu 關鍵字指定平均方向向量。 kappa 關鍵字指定濃度參數。
- mu: array_like
分布的平均方向。必須是範數為 1 的一維單位向量。
- kappa: 浮點數
濃度參數。必須是正的。
- seed: {無,int,np.random.RandomState,np.random.Generator},可選
用於繪製隨機變量。如果種子是None, 這RandomState使用單例。如果種子是一個 int,一個新的
RandomState使用實例,用種子播種。如果種子已經是一個RandomState或者Generator實例,然後使用該對象。默認為None.
參數 ::
注意:
von Mises-Fisher 分布是單位超球麵表麵上的方向分布。單位向量的概率密度函數為
其中是平均方向,是濃度參數,是尺寸,是第一類修正貝塞爾函數。由於 表示方向,因此它必須是單位向量,或者換句話說,超球麵上的點: 。 是一個濃度參數,這意味著它必須為正值 ( ),並且隨著 的增加,分布變得更窄。從這個意義上說,倒數類似於正態分布的方差參數。
von Mises-Fisher 分布通常用作球體上正態分布的模擬。直觀上,對於單位向量,有用的距離度量由它們之間的角度給出。這正是 von Mises-Fisher 概率密度函數中的標量積 所說明的:平均方向 和向量 之間的角度。它們之間的角度越大,觀察到該特定平均方向 的 的概率就越小。
在 2 維和 3 維中,使用專門的算法進行快速采樣 [2]、[3]。對於 4 或更高的維度,使用[4]中說明的拒絕采樣算法。該實現部分基於 geomstats 包 [5]、[6]。
參考:
[1]Von Mises-Fisher 分布,維基百科,https://en.wikipedia.org/wiki/Von_Mises%E2%80%93Fisher_distribution
[2]Mardia, K. 和 Jupp, P. 方向統計。威利,2000。
[3]J.文澤爾. S2 上 von Mises Fisher 分布的數值穩定采樣。https://www.mitsuba-renderer.org/~wenzel/files/vmf.pdf
[4]Wood, A. von Mises Fisher 分布的模擬。 statistics-simulation 中的通信和計算 23, 1 (1994), 157-164。 https://doi.org/10.1080/03610919408813161
[5]地理統計器,Github。麻省理工學院許可證。訪問時間:2023 年 1 月 6 日。 https://github.com/geomstats/geomstats
[6]米奧蘭,N.等人。 Geomstats:機器學習中黎曼幾何的 Python 包。機器學習研究雜誌 21 (2020)。 http://jmlr.org/papers/v21/19-027.html
例子:
概率密度的可視化
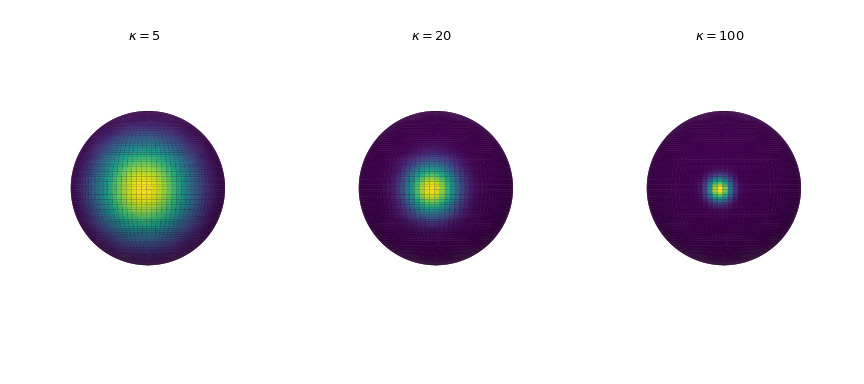
繪製三個維度的概率密度以增加濃度參數。密度通過
pdf方法計算。>>> import numpy as np >>> import matplotlib.pyplot as plt >>> from scipy.stats import vonmises_fisher >>> from matplotlib.colors import Normalize >>> n_grid = 100 >>> u = np.linspace(0, np.pi, n_grid) >>> v = np.linspace(0, 2 * np.pi, n_grid) >>> u_grid, v_grid = np.meshgrid(u, v) >>> vertices = np.stack([np.cos(v_grid) * np.sin(u_grid), ... np.sin(v_grid) * np.sin(u_grid), ... np.cos(u_grid)], ... axis=2) >>> x = np.outer(np.cos(v), np.sin(u)) >>> y = np.outer(np.sin(v), np.sin(u)) >>> z = np.outer(np.ones_like(u), np.cos(u)) >>> def plot_vmf_density(ax, x, y, z, vertices, mu, kappa): ... vmf = vonmises_fisher(mu, kappa) ... pdf_values = vmf.pdf(vertices) ... pdfnorm = Normalize(vmin=pdf_values.min(), vmax=pdf_values.max()) ... ax.plot_surface(x, y, z, rstride=1, cstride=1, ... facecolors=plt.cm.viridis(pdfnorm(pdf_values)), ... linewidth=0) ... ax.set_aspect('equal') ... ax.view_init(azim=-130, elev=0) ... ax.axis('off') ... ax.set_title(rf"$\kappa={kappa}$") >>> fig, axes = plt.subplots(nrows=1, ncols=3, figsize=(9, 4), ... subplot_kw={"projection": "3d"}) >>> left, middle, right = axes >>> mu = np.array([-np.sqrt(0.5), -np.sqrt(0.5), 0]) >>> plot_vmf_density(left, x, y, z, vertices, mu, 5) >>> plot_vmf_density(middle, x, y, z, vertices, mu, 20) >>> plot_vmf_density(right, x, y, z, vertices, mu, 100) >>> plt.subplots_adjust(top=1, bottom=0.0, left=0.0, right=1.0, wspace=0.) >>> plt.show()
當我們增加集中參數時,點在平均方向周圍變得更加聚集。
采樣
使用
rvs方法從分布中抽取 5 個樣本,生成 5x3 數組。>>> rng = np.random.default_rng() >>> mu = np.array([0, 0, 1]) >>> samples = vonmises_fisher(mu, 20).rvs(5, random_state=rng) >>> samples array([[ 0.3884594 , -0.32482588, 0.86231516], [ 0.00611366, -0.09878289, 0.99509023], [-0.04154772, -0.01637135, 0.99900239], [-0.14613735, 0.12553507, 0.98126695], [-0.04429884, -0.23474054, 0.97104814]])這些樣本是球體 上的單位向量。為了驗證,讓我們計算它們的歐幾裏得範數:
>>> np.linalg.norm(samples, axis=1)
array([1., 1., 1., 1., 1.])
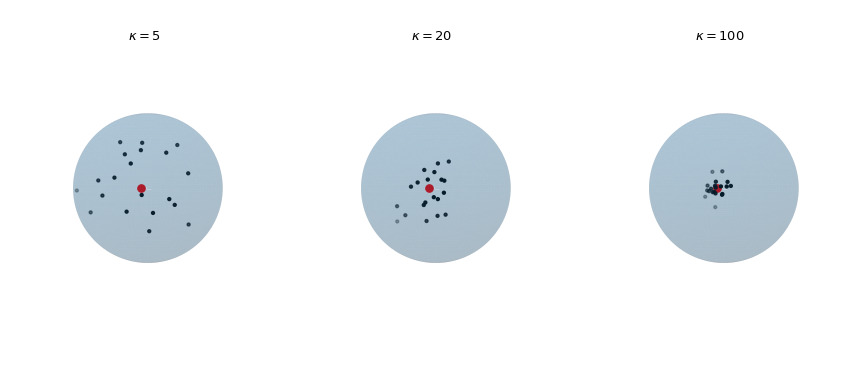
繪製從 von Mises-Fisher 分布中繪製的 20 個觀測值,以增加濃度參數 。紅點突出顯示平均方向 。
>>> def plot_vmf_samples(ax, x, y, z, mu, kappa):
...     vmf = vonmises_fisher(mu, kappa)
...     samples = vmf.rvs(20)
...     ax.plot_surface(x, y, z, rstride=1, cstride=1, linewidth=0,
...                     alpha=0.2)
...     ax.scatter(samples[:, 0], samples[:, 1], samples[:, 2], c='k', s=5)
...     ax.scatter(mu[0], mu[1], mu[2], c='r', s=30)
...     ax.set_aspect('equal')
...     ax.view_init(azim=-130, elev=0)
...     ax.axis('off')
...     ax.set_title(rf"$\kappa={kappa}$")
>>> mu = np.array([-np.sqrt(0.5), -np.sqrt(0.5), 0])
>>> fig, axes = plt.subplots(nrows=1, ncols=3,
...                          subplot_kw={"projection": "3d"},
...                          figsize=(9, 4))
>>> left, middle, right = axes
>>> plot_vmf_samples(left, x, y, z, mu, 5)
>>> plot_vmf_samples(middle, x, y, z, mu, 20)
>>> plot_vmf_samples(right, x, y, z, mu, 100)
>>> plt.subplots_adjust(top=1, bottom=0.0, left=0.0,
...                     right=1.0, wspace=0.)
>>> plt.show()
該圖顯示,隨著濃度 的增加,所得樣本更加集中在平均方向周圍。
擬合分布參數
可以使用返回估計參數的
fit方法將分布擬合到數據。作為一個玩具示例,讓我們將分布擬合到從已知 von Mises-Fisher 分布中抽取的樣本。>>> mu, kappa = np.array([0, 0, 1]), 20 >>> samples = vonmises_fisher(mu, kappa).rvs(1000, random_state=rng) >>> mu_fit, kappa_fit = vonmises_fisher.fit(samples) >>> mu_fit, kappa_fit (array([0.01126519, 0.01044501, 0.99988199]), 19.306398751730995)我們看到估計的參數mu_fit和kappa_fit非常接近地麵實況參數。
相關用法
- Python SciPy stats.vonmises_line用法及代碼示例
- Python SciPy stats.vonmises用法及代碼示例
- Python SciPy stats.variation用法及代碼示例
- Python SciPy stats.anderson用法及代碼示例
- Python SciPy stats.iqr用法及代碼示例
- Python SciPy stats.genpareto用法及代碼示例
- Python SciPy stats.skewnorm用法及代碼示例
- Python SciPy stats.cosine用法及代碼示例
- Python SciPy stats.norminvgauss用法及代碼示例
- Python SciPy stats.directional_stats用法及代碼示例
- Python SciPy stats.invwishart用法及代碼示例
- Python SciPy stats.bartlett用法及代碼示例
- Python SciPy stats.levy_stable用法及代碼示例
- Python SciPy stats.page_trend_test用法及代碼示例
- Python SciPy stats.itemfreq用法及代碼示例
- Python SciPy stats.exponpow用法及代碼示例
- Python SciPy stats.gumbel_l用法及代碼示例
- Python SciPy stats.chisquare用法及代碼示例
- Python SciPy stats.semicircular用法及代碼示例
- Python SciPy stats.gzscore用法及代碼示例
- Python SciPy stats.gompertz用法及代碼示例
- Python SciPy stats.normaltest用法及代碼示例
- Python SciPy stats.dirichlet_multinomial用法及代碼示例
- Python SciPy stats.genlogistic用法及代碼示例
- Python SciPy stats.skellam用法及代碼示例
注:本文由純淨天空篩選整理自scipy.org大神的英文原創作品 scipy.stats.vonmises_fisher。非經特殊聲明,原始代碼版權歸原作者所有,本譯文未經允許或授權,請勿轉載或複製。
