本文簡要介紹 python 語言中 scipy.stats.rv_histogram 的用法。
用法:
class scipy.stats.rv_histogram(histogram, *args, density=None, **kwargs)#生成由直方圖給出的分布。這對於從分箱數據樣本生成模板分布很有用。
作為
rv_continuous類的子類,rv_histogram繼承了一組通用方法(完整列表請參閱rv_continuous),並根據提供的分箱數據樣本的屬性來實現它們。- histogram: 數組 的元組
包含兩個 數組 對象的元組。第一個包含 n 個容器的內容,第二個包含 (n+1) 個容器邊界。特別是,接受
numpy.histogram的返回值。- density: 布爾型,可選
如果為 False,則假定直方圖與每個 bin 的計數成正比;否則,假設它與密度成正比。對於恒定的 bin 寬度,這些是等效的,但是當 bin 寬度變化時,區別很重要(參見注釋)。如果無(默認),則設置
density=True為了向後兼容,但如果 bin 寬度可變則發出警告。放密度明確地消除警告。
參數 ::
注意:
當直方圖具有不相等的箱寬度時,與每個箱的計數成比例的直方圖和與箱上的概率密度成比例的直方圖之間存在區別。如果使用默認值
density=False調用numpy.histogram,則生成的直方圖是每個 bin 的計數數,因此density=False應傳遞給rv_histogram。如果使用density=True調用numpy.histogram,則生成的直方圖是概率密度形式的,因此density=True應傳遞給rv_histogram。為了避免警告,當輸入直方圖具有不相等的 bin 寬度時,請始終顯式傳遞density。除了位置和比例之外,沒有其他形狀參數。 pdf 被定義為所提供直方圖的逐步函數。 cdf 是 pdf 的線性插值。
例子:
從 numpy 直方圖創建 scipy.stats 分布
>>> import scipy.stats
>>> import numpy as np
>>> data = scipy.stats.norm.rvs(size=100000, loc=0, scale=1.5,
...                             random_state=123)
>>> hist = np.histogram(data, bins=100)
>>> hist_dist = scipy.stats.rv_histogram(hist, density=False)
表現得像一個普通的 scipy rv_continuous 分布
>>> hist_dist.pdf(1.0)
0.20538577847618705
>>> hist_dist.cdf(2.0)
0.90818568543056499
PDF 在直方圖的最高(最低)區間上方(下方)為零,由原始數據集的最大值(最小值)定義
>>> hist_dist.pdf(np.max(data))
0.0
>>> hist_dist.cdf(np.max(data))
1.0
>>> hist_dist.pdf(np.min(data))
7.7591907244498314e-05
>>> hist_dist.cdf(np.min(data))
0.0
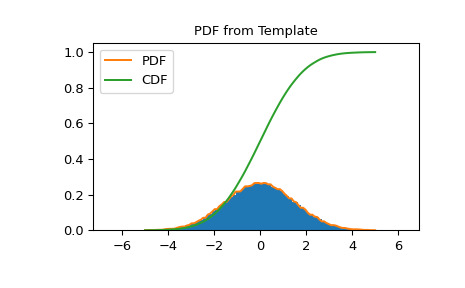
PDF 和 CDF 遵循直方圖
>>> import matplotlib.pyplot as plt
>>> X = np.linspace(-5.0, 5.0, 100)
>>> fig, ax = plt.subplots()
>>> ax.set_title("PDF from Template")
>>> ax.hist(data, density=True, bins=100)
>>> ax.plot(X, hist_dist.pdf(X), label='PDF')
>>> ax.plot(X, hist_dist.cdf(X), label='CDF')
>>> ax.legend()
>>> fig.show()
random_state獲取或設置生成隨機變量的生成器對象。
屬性 ::
相關用法
- Python SciPy stats.rv_discrete用法及代碼示例
- Python SciPy stats.rv_continuous用法及代碼示例
- Python SciPy stats.rvs_ratio_uniforms用法及代碼示例
- Python SciPy stats.rayleigh用法及代碼示例
- Python SciPy stats.rankdata用法及代碼示例
- Python SciPy stats.random_table用法及代碼示例
- Python SciPy stats.recipinvgauss用法及代碼示例
- Python SciPy stats.rel_breitwigner用法及代碼示例
- Python SciPy stats.rice用法及代碼示例
- Python SciPy stats.random_correlation用法及代碼示例
- Python SciPy stats.ranksums用法及代碼示例
- Python SciPy stats.relfreq用法及代碼示例
- Python SciPy stats.randint用法及代碼示例
- Python SciPy stats.rdist用法及代碼示例
- Python SciPy stats.anderson用法及代碼示例
- Python SciPy stats.iqr用法及代碼示例
- Python SciPy stats.genpareto用法及代碼示例
- Python SciPy stats.skewnorm用法及代碼示例
- Python SciPy stats.cosine用法及代碼示例
- Python SciPy stats.norminvgauss用法及代碼示例
- Python SciPy stats.directional_stats用法及代碼示例
- Python SciPy stats.invwishart用法及代碼示例
- Python SciPy stats.bartlett用法及代碼示例
- Python SciPy stats.levy_stable用法及代碼示例
- Python SciPy stats.page_trend_test用法及代碼示例
注:本文由純淨天空篩選整理自scipy.org大神的英文原創作品 scipy.stats.rv_histogram。非經特殊聲明,原始代碼版權歸原作者所有,本譯文未經允許或授權,請勿轉載或複製。
