本文簡要介紹 python 語言中 numpy.histogram 的用法。
用法:
numpy.histogram(a, bins=10, range=None, normed=None, weights=None, density=None)計算數據集的直方圖。
- a: array_like
輸入數據。直方圖是在展平的數組上計算的。
- bins: int 或標量序列或 str,可選
如果 bins 是一個 int,它定義給定範圍內的 equal-width bins 的數量(默認為 10)。如果 bins 是一個序列,它定義了一個單調遞增的 bin 邊數組,包括最右邊的邊,允許不均勻的 bin 寬度。
如果箱子是一個字符串,它定義了用於計算最佳 bin 寬度的方法,定義為numpy.histogram_bin_edges.
- range: (浮點數,浮點數),可選
bin 的下限和上限範圍。如果沒有提供,範圍很簡單
(a.min(), a.max()).超出範圍的值將被忽略。範圍的第一個元素必須小於或等於第二個元素。範圍也會影響自動 bin 計算。雖然根據內部的實際數據計算出 bin 寬度是最佳的範圍, bin 計數將填充整個範圍,包括不包含數據的部分。- normed: 布爾型,可選
-
這等效於密度參數,但會為不相等的 bin 寬度產生不正確的結果。它不應該被使用。
- weights: 數組,可選
一組權重,與 a 的形狀相同。 a 中的每個值僅將其相關權重貢獻給 bin 計數(而不是 1)。如果密度為真,則權重被歸一化,因此密度在該範圍內的積分保持為 1。
- density: 布爾型,可選
如果
False,結果將包含每個 bin 中的樣本數。如果True, 結果就是概率的值密度在 bin 處的函數,歸一化使得不可缺少的在範圍內為 1。請注意,直方圖值的總和將不等於 1,除非選擇了統一寬度的 bin;這不是概率大量的函數。如果給定,則覆蓋
normed關鍵字。
- hist: 數組
直方圖的值。有關可能語義的說明,請參見密度和權重。
- bin_edges: dtype 浮點數組
返回 bin 邊
(length(hist)+1)。
參數:
返回:
注意:
除了最後一個 (righthand-most) 箱子之外的所有箱子都是半開的。換句話說,如果 bins 是:
[1, 2, 3, 4]那麽第一個箱子是
[1, 2)(包括1個,但不包括2個)和第二個[2, 3).然而,最後一個箱子是[3, 4], 哪一個包括 4.例子:
>>> np.histogram([1, 2, 1], bins=[0, 1, 2, 3])
(array([0, 2, 1]), array([0, 1, 2, 3]))
>>> np.histogram(np.arange(4), bins=np.arange(5), density=True)
(array([0.25, 0.25, 0.25, 0.25]), array([0, 1, 2, 3, 4]))
>>> np.histogram([[1, 2, 1], [1, 0, 1]], bins=[0,1,2,3])
(array([1, 4, 1]), array([0, 1, 2, 3]))
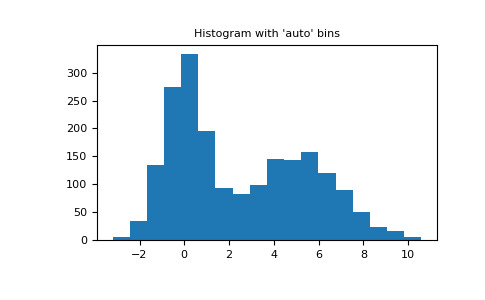
>>> a = np.arange(5) >>> hist, bin_edges = np.histogram(a, density=True) >>> hist array([0.5, 0. , 0.5, 0. , 0. , 0.5, 0. , 0.5, 0. , 0.5]) >>> hist.sum() 2.4999999999999996 >>> np.sum(hist * np.diff(bin_edges)) 1.0自動 Bin 選擇方法示例,使用 2 個具有 2000 個點的峰值隨機數據:
>>> import matplotlib.pyplot as plt
>>> rng = np.random.RandomState(10)  # deterministic random data
>>> a = np.hstack((rng.normal(size=1000),
...                rng.normal(loc=5, scale=2, size=1000)))
>>> _ = plt.hist(a, bins='auto')  # arguments are passed to np.histogram
>>> plt.title("Histogram with 'auto' bins")
Text(0.5, 1.0, "Histogram with 'auto' bins")
>>> plt.show()
相關用法
- Python numpy histogramdd用法及代碼示例
- Python numpy histogram2d用法及代碼示例
- Python numpy histogram_bin_edges用法及代碼示例
- Python numpy hamming用法及代碼示例
- Python numpy hermite.hermfromroots用法及代碼示例
- Python numpy hermite_e.hermediv用法及代碼示例
- Python numpy hsplit用法及代碼示例
- Python numpy hermite.hermline用法及代碼示例
- Python numpy hermite.hermpow用法及代碼示例
- Python numpy hermite.hermx用法及代碼示例
- Python numpy hermite_e.hermefromroots用法及代碼示例
- Python numpy hermite.hermmul用法及代碼示例
- Python numpy hermite.herm2poly用法及代碼示例
- Python numpy hermite.hermsub用法及代碼示例
- Python numpy hermite_e.hermeline用法及代碼示例
- Python numpy hermite_e.hermeint用法及代碼示例
- Python numpy hermite_e.hermeadd用法及代碼示例
- Python numpy hstack用法及代碼示例
- Python numpy hermite_e.poly2herme用法及代碼示例
- Python numpy hermite.hermdiv用法及代碼示例
- Python numpy hermite_e.hermevander用法及代碼示例
- Python numpy hermite_e.hermepow用法及代碼示例
- Python numpy hermite.poly2herm用法及代碼示例
- Python numpy hermite_e.hermetrim用法及代碼示例
- Python numpy hermite_e.hermezero用法及代碼示例
注:本文由純淨天空篩選整理自numpy.org大神的英文原創作品 numpy.histogram。非經特殊聲明,原始代碼版權歸原作者所有,本譯文未經允許或授權,請勿轉載或複製。
