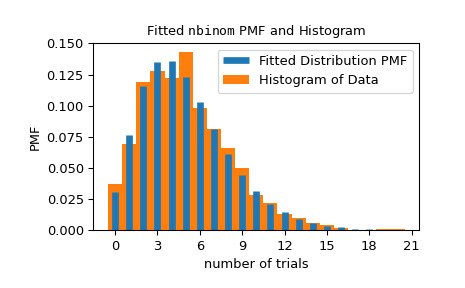
本文簡要介紹 python 語言中 scipy.stats._result_classes.FitResult.plot 的用法。
用法:
FitResult.plot(ax=None, *, plot_type='hist')#直觀地將數據與擬合分布進行比較。
僅當安裝了
matplotlib時才可用。- ax:
matplotlib.axes.Axes 用於繪製繪圖的 Axes 對象,否則使用當前 Axes。
- plot_type: {“hist”, “qq”, “pp”, “cdf”}
要繪製的繪圖類型。選項包括:
“hist”:將擬合分布的 PDF/PMF 疊加在數據的歸一化直方圖上。
“qq”:理論分位數與經驗分位數的散點圖。具體來說,x 坐標是在百分位數
(np.arange(1, n) - 0.5)/n處評估的擬合分布 PPF 的值,其中n是數據點的數量,y 坐標是排序的數據點。“pp”:理論百分位數與觀察到的百分位數的散點圖。具體來說,x 坐標是百分位數
(np.arange(1, n) - 0.5)/n,其中n是數據點的數量,y 坐標是在排序數據點處評估的擬合分布 CDF 的值。“cdf”:將擬合分布的 CDF 疊加到經驗 CDF 上。具體來說,經驗 CDF 的 x 坐標是排序的數據點,y 坐標是百分位數
(np.arange(1, n) - 0.5)/n,其中n是數據點的數量。
- ax:
- ax:
matplotlib.axes.Axes 繪製繪圖的 matplotlib Axes 對象。
- ax:
參數 ::
返回 ::
例子:
>>> import numpy as np >>> from scipy import stats >>> import matplotlib.pyplot as plt # matplotlib must be installed >>> rng = np.random.default_rng() >>> data = stats.nbinom(5, 0.5).rvs(size=1000, random_state=rng) >>> bounds = [(0, 30), (0, 1)] >>> res = stats.fit(stats.nbinom, data, bounds) >>> ax = res.plot() # save matplotlib Axes objectmatplotlib.axes.Axes對象可用於自定義繪圖。有關詳細信息,請參閱matplotlib.axes.Axes文檔。>>> ax.set_xlabel('number of trials') # customize axis label >>> ax.get_children()[0].set_linewidth(5) # customize line widths >>> ax.legend() >>> plt.show()
相關用法
- Python SciPy FortranFile.read_record用法及代碼示例
- Python SciPy FortranFile.write_record用法及代碼示例
- Python SciPy FastGeneratorInversion.evaluate_error用法及代碼示例
- Python SciPy FastGeneratorInversion.support用法及代碼示例
- Python SciPy interpolate.make_interp_spline用法及代碼示例
- Python SciPy stats.anderson用法及代碼示例
- Python SciPy ClusterNode.pre_order用法及代碼示例
- Python SciPy stats.iqr用法及代碼示例
- Python SciPy ndimage.correlate用法及代碼示例
- Python SciPy special.exp1用法及代碼示例
- Python SciPy special.expn用法及代碼示例
- Python SciPy signal.czt_points用法及代碼示例
- Python SciPy interpolate.krogh_interpolate用法及代碼示例
- Python SciPy ndimage.morphological_gradient用法及代碼示例
- Python SciPy distance.sokalmichener用法及代碼示例
- Python SciPy linalg.eigvalsh_tridiagonal用法及代碼示例
- Python SciPy linalg.cdf2rdf用法及代碼示例
- Python SciPy csc_array.diagonal用法及代碼示例
- Python SciPy fft.idctn用法及代碼示例
- Python SciPy linalg.LaplacianNd用法及代碼示例
- Python SciPy linalg.solve_circulant用法及代碼示例
- Python SciPy hierarchy.ward用法及代碼示例
- Python SciPy signal.chirp用法及代碼示例
- Python SciPy stats.genpareto用法及代碼示例
- Python SciPy ndimage.variance用法及代碼示例
注:本文由純淨天空篩選整理自scipy.org大神的英文原創作品 scipy.stats._result_classes.FitResult.plot。非經特殊聲明,原始代碼版權歸原作者所有,本譯文未經允許或授權,請勿轉載或複製。
