該方法用於計算沿給定軸的一維樣條濾波器。這些由樣條濾波器過濾。
用法:scipy.ndimage.spline_filter1d(input, order=3, axis=-1, output=<class ‘numpy.float64’>)
參數
input:數組-輸入數組
order:int-樣條曲線的順序,默認為3。
axis:int,-樣條線過濾器沿其應用的軸。默認為最後一個軸。
output:ndarray-放置輸出的數組,或者返回的數組的dtype。默認值為numpy.float64。
範例1:
Python3
# importing spline filter with one dimension.
from scipy.ndimage import spline_filter1d

# importing matplot library for visualiation
import matplotlib.pyplot as plt

# importing munpy module
import numpy as np

# creating an image
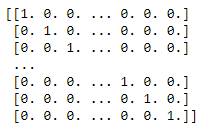
geek_image = np.eye(80)

# returns an image array format
geek_image[40,:] = 1.0
print(geek_image)
輸出:

範例2:
Python3
# importing spline filter with one dimension.
from scipy.ndimage import spline_filter1d

# importing matplot library for visualiation
import matplotlib.pyplot as plt

# importing munpy module
import numpy as np

# creating an image
geek_image = np.eye(80)

geek_image[40,:] = 1.0

# in axis=0
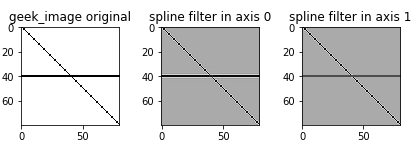
axis_0 = spline_filter1d(geek_image, axis=0)

# in axis=1
axis_1 = spline_filter1d(geek_image, axis=1)

f, ax = plt.subplots(1, 3, sharex=True)

for ind, data in enumerate([[geek_image, "geek_image original"],
                            [axis_0, "spline filter in axis 0"],
                            [axis_1, "spline filter in axis 1"]]):
    ax[ind].imshow(data[0], cmap='gray_r')

    # giving title
    ax[ind].set_title(data[1])

    # orientation layout of our image
plt.tight_layout()

# to show image
plt.show()
輸出:

相關用法
- Python Scipy stats.tsem()用法及代碼示例
- Python Scipy stats.tvar()用法及代碼示例
- Python Scipy stats.gmean()用法及代碼示例
- Python Scipy stats.tmin()用法及代碼示例
- Python Scipy stats.tstd()用法及代碼示例
- Python Scipy stats.tmax()用法及代碼示例
- Python Scipy stats.describe()用法及代碼示例
- Python Scipy stats.mean()用法及代碼示例
- Python Scipy stats.nanmedian()用法及代碼示例
- Python Scipy stats.nanstd()用法及代碼示例
- Python Scipy stats.nanmean()用法及代碼示例
- Python Scipy stats.moment()用法及代碼示例
- Python Scipy stats.mode()用法及代碼示例
- Python Scipy stats.normaltest()用法及代碼示例
- Python Scipy stats.skewtest()用法及代碼示例
- Python Scipy stats.kurtosis()用法及代碼示例
- Python Scipy stats.kurtosistest()用法及代碼示例
- Python Scipy stats.relfreq()用法及代碼示例
- Python Scipy stats.scoreatpercentile()用法及代碼示例
- Python Scipy stats.itemfreq()用法及代碼示例
- Python Scipy stats.histogram()用法及代碼示例
- Python Scipy stats.cumfreq()用法及代碼示例
- Python Scipy stats.variation()用法及代碼示例
- Python Scipy stats.binned_statistic_dd()用法及代碼示例
注:本文由純淨天空篩選整理自sravankumar8128大神的英文原創作品 Python SciPy – ndimage.spline_filter1d() function。非經特殊聲明,原始代碼版權歸原作者所有,本譯文未經允許或授權,請勿轉載或複製。
