用法:
pandas.plotting.autocorrelation_plot(series, ax=None, **kwargs)時間序列的自相關圖。
- series:時間序列
- ax:Matplotlib 軸對象,可選
- **kwargs:
傳遞給 matplotlib 繪圖方法的選項。
- 類:
matplotlib.axis.Axes
- 類:
參數:
返回:
例子:
圖中的水平線對應於 95% 和 99% 的置信帶。
虛線是 99% 置信帶。
>>> spacing = np.linspace(-9 * np.pi, 9 * np.pi, num=1000)
>>> s = pd.Series(0.7 * np.random.rand(1000) + 0.3 * np.sin(spacing))
>>> pd.plotting.autocorrelation_plot(s)
<AxesSubplot:title={'center':'width'}, xlabel='Lag', ylabel='Autocorrelation'>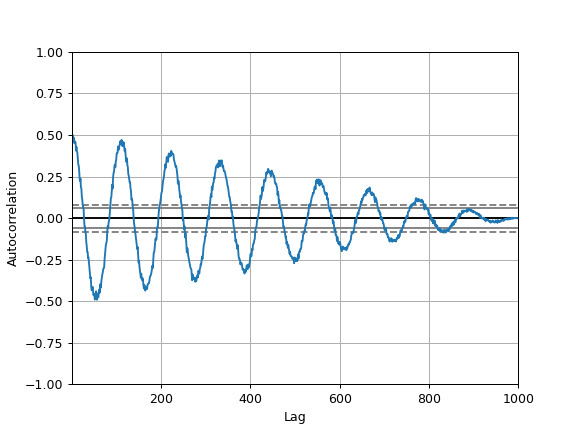
相關用法
- Python pandas.plotting.andrews_curves用法及代碼示例
- Python pandas.plotting.bootstrap_plot用法及代碼示例
- Python pandas.plotting.scatter_matrix用法及代碼示例
- Python pandas.plotting.radviz用法及代碼示例
- Python pandas.plotting.parallel_coordinates用法及代碼示例
- Python pandas.plotting.lag_plot用法及代碼示例
- Python pandas.plotting.boxplot用法及代碼示例
- Python pandas.pivot用法及代碼示例
- Python pandas.period_range用法及代碼示例
- Python pandas.period_range()用法及代碼示例
- Python pandas.pivot_table用法及代碼示例
- Python pandas.arrays.IntervalArray.is_empty用法及代碼示例
- Python pandas.DataFrame.ewm用法及代碼示例
- Python pandas.api.types.is_timedelta64_ns_dtype用法及代碼示例
- Python pandas.DataFrame.dot用法及代碼示例
- Python pandas.DataFrame.apply用法及代碼示例
- Python pandas.DataFrame.combine_first用法及代碼示例
- Python pandas.read_pickle用法及代碼示例
- Python pandas.Index.value_counts用法及代碼示例
- Python pandas.DatetimeTZDtype用法及代碼示例
注:本文由純淨天空篩選整理自pandas.pydata.org大神的英文原創作品 pandas.plotting.autocorrelation_plot。非經特殊聲明,原始代碼版權歸原作者所有,本譯文未經允許或授權,請勿轉載或複製。