用法:
pandas.plotting.lag_plot(series, lag=1, ax=None, **kwds)時間序列的滯後圖。
- series:時間序列
- lag:散點圖的滯後,默認1
- ax:Matplotlib 軸對象,可選
- **kwds:
Matplotlib scatter 方法關鍵字參數。
- 類:
matplotlib.axis.Axes
- 類:
參數:
返回:
例子:
滯後圖最常用於尋找時間序列數據中的模式。
給定以下時間序列
>>> np.random.seed(5)
>>> x = np.cumsum(np.random.normal(loc=1, scale=5, size=50))
>>> s = pd.Series(x)
>>> s.plot()
<AxesSubplot:xlabel='Midrange'>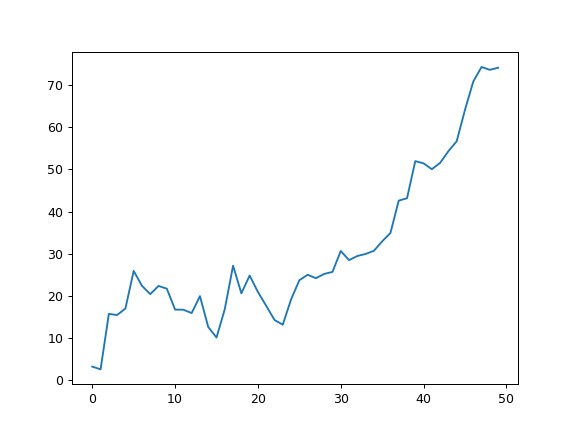
帶有
lag=1的滯後圖返回>>> pd.plotting.lag_plot(s, lag=1) <AxesSubplot:xlabel='y(t)', ylabel='y(t + 1)'>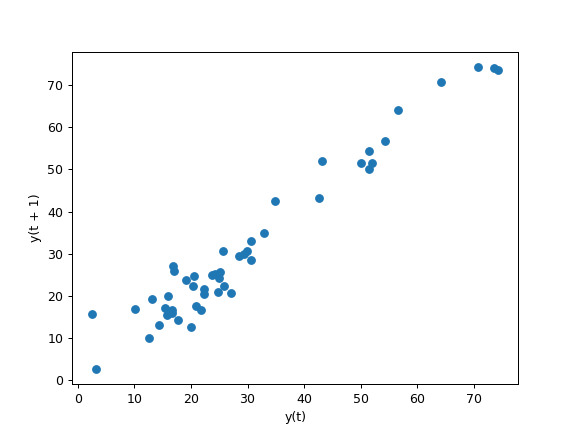
相關用法
- Python pandas.plotting.autocorrelation_plot用法及代碼示例
- Python pandas.plotting.bootstrap_plot用法及代碼示例
- Python pandas.plotting.scatter_matrix用法及代碼示例
- Python pandas.plotting.radviz用法及代碼示例
- Python pandas.plotting.parallel_coordinates用法及代碼示例
- Python pandas.plotting.andrews_curves用法及代碼示例
- Python pandas.plotting.boxplot用法及代碼示例
- Python pandas.pivot用法及代碼示例
- Python pandas.period_range用法及代碼示例
- Python pandas.period_range()用法及代碼示例
- Python pandas.pivot_table用法及代碼示例
- Python pandas.arrays.IntervalArray.is_empty用法及代碼示例
- Python pandas.DataFrame.ewm用法及代碼示例
- Python pandas.api.types.is_timedelta64_ns_dtype用法及代碼示例
- Python pandas.DataFrame.dot用法及代碼示例
- Python pandas.DataFrame.apply用法及代碼示例
- Python pandas.DataFrame.combine_first用法及代碼示例
- Python pandas.read_pickle用法及代碼示例
- Python pandas.Index.value_counts用法及代碼示例
- Python pandas.DatetimeTZDtype用法及代碼示例
注:本文由純淨天空篩選整理自pandas.pydata.org大神的英文原創作品 pandas.plotting.lag_plot。非經特殊聲明,原始代碼版權歸原作者所有,本譯文未經允許或授權,請勿轉載或複製。