用法:
pandas.plotting.radviz(frame, class_column, ax=None, color=None, colormap=None, **kwds)在 2D 中繪製多維數據集。
DataFrame 中的每個係列都表示為圓形上均勻分布的切片。每個數據點根據每個係列上的值呈現在圓圈中。
DataFrame中高度相關的Series更靠近單位圓。RadViz 允許將 N 維數據集投影到 2D 空間中,其中每個維度的影響可以解釋為所有維度影響之間的平衡。
更多信息可在說明 RadViz 的original article 中找到。
- frame:
DataFrame 保存數據的對象。
- class_column:str
包含數據點類別名稱的列名。
- ax:
matplotlib.axes.Axes,可選 要向其添加信息的繪圖實例。
- color:list[str] 或 tuple[str],可選
為每個類別分配一種顏色。示例:[‘blue’, ‘green’]。
- colormap:str 或
matplotlib.colors.Colormap,默認無 從中選擇顏色的顏色圖。如果是字符串,則從 matplotlib 加載具有該名稱的顏色圖。
- **kwds:
傳遞給 matplotlib 散點圖方法的選項。
- frame:
- 類:
matplotlib.axes.Axes
- 類:
參數:
返回:
例子:
>>> df = pd.DataFrame(
...     {
...         'SepalLength': [6.5, 7.7, 5.1, 5.8, 7.6, 5.0, 5.4, 4.6, 6.7, 4.6],
...         'SepalWidth': [3.0, 3.8, 3.8, 2.7, 3.0, 2.3, 3.0, 3.2, 3.3, 3.6],
...         'PetalLength': [5.5, 6.7, 1.9, 5.1, 6.6, 3.3, 4.5, 1.4, 5.7, 1.0],
...         'PetalWidth': [1.8, 2.2, 0.4, 1.9, 2.1, 1.0, 1.5, 0.2, 2.1, 0.2],
...         'Category': [
...             'virginica',
...             'virginica',
...             'setosa',
...             'virginica',
...             'virginica',
...             'versicolor',
...             'versicolor',
...             'setosa',
...             'virginica',
...             'setosa'
...         ]
...     }
... )
>>> pd.plotting.radviz(df, 'Category')
<AxesSubplot:xlabel='y(t)', ylabel='y(t + 1)'>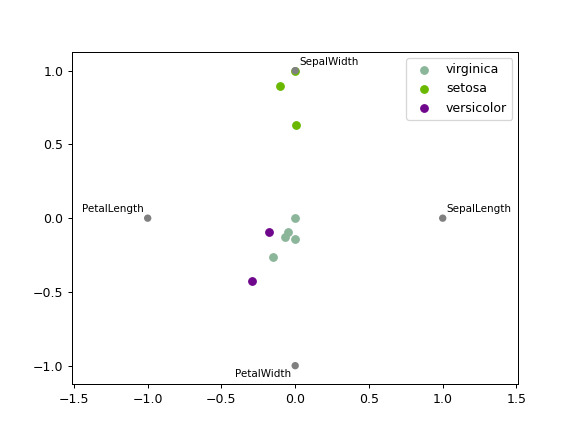
相關用法
- Python pandas.plotting.autocorrelation_plot用法及代碼示例
- Python pandas.plotting.bootstrap_plot用法及代碼示例
- Python pandas.plotting.scatter_matrix用法及代碼示例
- Python pandas.plotting.parallel_coordinates用法及代碼示例
- Python pandas.plotting.andrews_curves用法及代碼示例
- Python pandas.plotting.lag_plot用法及代碼示例
- Python pandas.plotting.boxplot用法及代碼示例
- Python pandas.pivot用法及代碼示例
- Python pandas.period_range用法及代碼示例
- Python pandas.period_range()用法及代碼示例
- Python pandas.pivot_table用法及代碼示例
- Python pandas.arrays.IntervalArray.is_empty用法及代碼示例
- Python pandas.DataFrame.ewm用法及代碼示例
- Python pandas.api.types.is_timedelta64_ns_dtype用法及代碼示例
- Python pandas.DataFrame.dot用法及代碼示例
- Python pandas.DataFrame.apply用法及代碼示例
- Python pandas.DataFrame.combine_first用法及代碼示例
- Python pandas.read_pickle用法及代碼示例
- Python pandas.Index.value_counts用法及代碼示例
- Python pandas.DatetimeTZDtype用法及代碼示例
注:本文由純淨天空篩選整理自pandas.pydata.org大神的英文原創作品 pandas.plotting.radviz。非經特殊聲明,原始代碼版權歸原作者所有,本譯文未經允許或授權,請勿轉載或複製。