示例簡介
代碼實現[Python]
# -*- coding: utf-8 -*-
print(__doc__)

# Author: Gael Varoquaux
# License: BSD 3 clause

# 導入繪圖包matplotlib
import matplotlib.pyplot as plt

# 導入數據集、分類器及性能評估器
from sklearn import datasets, svm, metrics

# The digits dataset
digits = datasets.load_digits()

# 我們感興趣的數據是由8x8的數字圖像組成的,讓我們
# 看一下存儲在數據集的"images"屬性中的前4張圖像。處
# 理圖像文件,則可以使用matplotlib.pyplot.imread加載它們。
# 請注意,每個圖像必須具有相同的大小。對於這些圖像,我們知道它們代表哪個數字:它在數據集的“target”中給出。
images_and_labels = list(zip(digits.images, digits.target))
for index, (image, label) in enumerate(images_and_labels[:4]):
    plt.subplot(2, 4, index + 1)
    plt.axis('off')
    plt.imshow(image, cmap=plt.cm.gray_r, interpolation='nearest')
    plt.title('Training: %i' % label)

# 要對該數據應用分類器,我們需要將圖像展平,以將數據轉換為(樣本,特征)矩陣:
n_samples = len(digits.images)
data = digits.images.reshape((n_samples, -1))

# 創建分類器: 一個支持向量機分類器
classifier = svm.SVC(gamma=0.001)

# 我們使用數據集的前半部分學習數字識別模型
classifier.fit(data[:n_samples // 2], digits.target[:n_samples // 2])

# 預測數據集的剩下部分的數字:
expected = digits.target[n_samples // 2:]
predicted = classifier.predict(data[n_samples // 2:])

print("Classification report for classifier %s:\n%s\n"
      % (classifier, metrics.classification_report(expected, predicted)))
print("Confusion matrix:\n%s" % metrics.confusion_matrix(expected, predicted))

images_and_predictions = list(zip(digits.images[n_samples // 2:], predicted))
for index, (image, prediction) in enumerate(images_and_predictions[:4]):
    plt.subplot(2, 4, index + 5)
    plt.axis('off')
    plt.imshow(image, cmap=plt.cm.gray_r, interpolation='nearest')
    plt.title('Prediction: %i' % prediction)

plt.show()
代碼執行
代碼運行時間大約:0分0.237秒。
運行代碼輸出的文本內容如下:
Classification report for classifier SVC(gamma=0.001):
              precision    recall  f1-score   support

           0       1.00      0.99      0.99        88
           1       0.99      0.97      0.98        91
           2       0.99      0.99      0.99        86
           3       0.98      0.87      0.92        91
           4       0.99      0.96      0.97        92
           5       0.95      0.97      0.96        91
           6       0.99      0.99      0.99        91
           7       0.96      0.99      0.97        89
           8       0.94      1.00      0.97        88
           9       0.93      0.98      0.95        92

    accuracy                           0.97       899
   macro avg       0.97      0.97      0.97       899
weighted avg       0.97      0.97      0.97       899


Confusion matrix:
[[87  0  0  0  1  0  0  0  0  0]
 [ 0 88  1  0  0  0  0  0  1  1]
 [ 0  0 85  1  0  0  0  0  0  0]
 [ 0  0  0 79  0  3  0  4  5  0]
 [ 0  0  0  0 88  0  0  0  0  4]
 [ 0  0  0  0  0 88  1  0  0  2]
 [ 0  1  0  0  0  0 90  0  0  0]
 [ 0  0  0  0  0  1  0 88  0  0]
 [ 0  0  0  0  0  0  0  0 88  0]
 [ 0  0  0  1  0  1  0  0  0 90]]
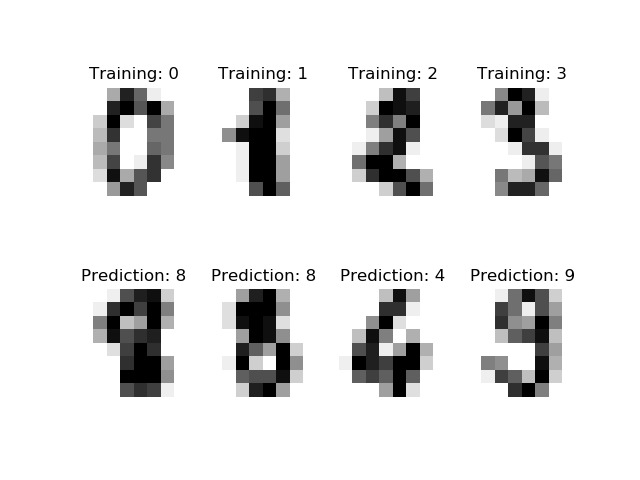
運行代碼輸出的圖片內容如下:

源碼下載
- Python版源碼文件: plot_digits_classification.py
- Jupyter Notebook版源碼文件: plot_digits_classification.ipynb
