scipy.stats.skew(array, axis=0, bias=True)函数计算数据集的偏度。
skewness = 0 : normally distributed.
skewness > 0 : more weight in the left tail of the distribution.
skewness < 0 : more weight in the right tail of the distribution.
其公式-
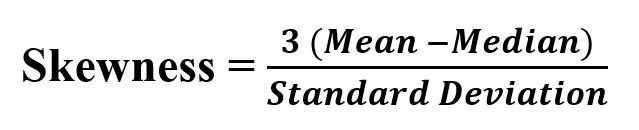
参数:
array :具有元素的输入数组或对象。
axis :要测量偏度值的轴。默认情况下,轴= 0。
bias :布尔如果设置为False,则针对统计偏差对计算进行校正。
返回值:数据集沿轴的偏度值。
代码1:
# Graph using numpy.linspace()
# finding Skewness

from scipy.stats import skew
import numpy as np
import pylab as p

x1 = np.linspace( -5, 5, 1000 )
y1 = 1./(np.sqrt(2.*np.pi)) * np.exp( -.5*(x1)**2  )

p.plot(x1, y1, '*')

print( '\nSkewness for data : ', skew(y1))
输出:
Skewness for data : 1.1108237139164436
代码2:
# Graph using numpy.linspace()
# finding Skewness


from scipy.stats import skew
import numpy as np
import pylab as p

x1 = np.linspace( -5, 12, 1000 )
y1 = 1./(np.sqrt(2.*np.pi)) * np.exp( -.5*(x1)**2  )

p.plot(x1, y1, '.')

print( '\nSkewness for data : ', skew(y1))
输出:
Skewness for data : 1.917677776148478
代码3:关于随机数据
# finding Skewness

from scipy.stats import skew
import numpy as np

# random values based on a normal distribution
x = np.random.normal(0, 2, 10000)

print ("X : \n", x)

print('\nSkewness for data : ', skew(x))
输出:
X :
 [ 0.03255323 -6.18574775 -0.58430139 ...  3.22112446  1.16543279
  0.84083317]

Skewness for data :  0.03248837584866293
相关用法
- Python Scipy stats.chi()用法及代码示例
- Python Scipy stats.f()用法及代码示例
- Python Scipy stats.hmean()用法及代码示例
- Python Scipy stats.halflogistic()用法及代码示例
- Python Scipy stats.alpha()用法及代码示例
- Python Scipy stats.halfnorm()用法及代码示例
- Python Scipy stats.gompertz()用法及代码示例
- Python Scipy stats.genlogistic()用法及代码示例
- Python Scipy stats.fatiguelife()用法及代码示例
- Python Scipy stats.fisk()用法及代码示例
- Python Scipy stats.tmean()用法及代码示例
- Python Scipy stats.genexpon()用法及代码示例
- Python Scipy stats.genpareto()用法及代码示例
- Python Scipy stats.mean()用法及代码示例
- Python Scipy stats.gumbel_r()用法及代码示例
注:本文由纯净天空筛选整理自vishal3096大神的英文原创作品 scipy stats.skew() | Python。非经特殊声明,原始代码版权归原作者所有,本译文未经允许或授权,请勿转载或复制。