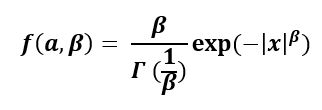
scipy.stats.halfgennorm()是广义正常连续随机变量的上半部分。为了完成其规格,它以标准格式和一些形状参数定义。对象对象从中继承了通用方法的集合,并用特定的细节来完善它们。
参数:
-> α:scale
-> β:shape
-> μ:location
代码1:创建半广义普通连续随机变量
from scipy.stats import halfgennorm

numargs = halfgennorm.numargs
[a] = [0.7, ] * numargs
rv = halfgennorm (a)

print ("RV:\n", rv)
输出:
RV:
 scipy.stats._distn_infrastructure.rv_frozen object at 0x0000021FB55D8DD8
代码2:半广义随机变量和概率分布
import numpy as np
quantile = np.arange (0.01, 1, 0.1)

# Random Variates
R = halfgennorm .rvs(.2, scale = 2,  size = 10)
print ("Random Variates:\n", R)

# PDF
R = halfgennorm .pdf(quantile, .2, loc = 0, scale = 1)
print ("\nProbability Distribution:\n", R)
输出:
Random Variates:
 [1.41299459e+03 3.51301175e+04 1.79981484e+05 2.90925518e+02
 2.70178121e+05 1.31706797e+05 3.25898913e+01 1.62607410e+04
 2.02263946e+04 1.97078668e+04]

Probability Distribution:
 [0.00559658 0.0043805  0.00400834 0.0037776  0.00360957 0.00347731
 0.00336825 0.00327549 0.00319482 0.00312348]
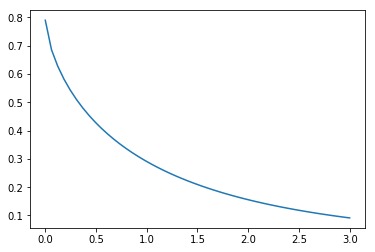
代码3:图形表示。
import numpy as np
import matplotlib.pyplot as plt

distribution = np.linspace(0, np.minimum(rv.dist.b, 3))
print("Distribution:\n", distribution)

plot = plt.plot(distribution, rv.pdf(distribution))
输出:
Distribution:
 [0.         0.06122449 0.12244898 0.18367347 0.24489796 0.30612245
 0.36734694 0.42857143 0.48979592 0.55102041 0.6122449  0.67346939
 0.73469388 0.79591837 0.85714286 0.91836735 0.97959184 1.04081633
 1.10204082 1.16326531 1.2244898  1.28571429 1.34693878 1.40816327
 1.46938776 1.53061224 1.59183673 1.65306122 1.71428571 1.7755102
 1.83673469 1.89795918 1.95918367 2.02040816 2.08163265 2.14285714
 2.20408163 2.26530612 2.32653061 2.3877551  2.44897959 2.51020408
 2.57142857 2.63265306 2.69387755 2.75510204 2.81632653 2.87755102
 2.93877551 3.        ]
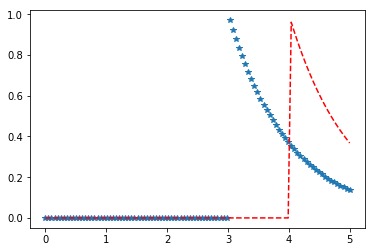
代码4:更改位置参数
import matplotlib.pyplot as plt
import numpy as np

x = np.linspace(0, 5, 100)

# Varying positional arguments
y1 = halfgennorm .pdf(x, 1, 3)
y2 = halfgennorm .pdf(x, 1, 4)
plt.plot(x, y1, "*", x, y2, "r--")
输出:
相关用法
- Python Scipy stats.chi()用法及代码示例
- Python Scipy stats.f()用法及代码示例
- Python Scipy stats.exponpow()用法及代码示例
- Python Scipy stats.percentileofscore()用法及代码示例
- Python Scipy stats.exponweib()用法及代码示例
- Python Scipy stats.bradford()用法及代码示例
- Python Scipy stats.halflogistic()用法及代码示例
- Python Scipy stats.fatiguelife()用法及代码示例
- Python Scipy stats.gompertz()用法及代码示例
- Python Scipy stats.skew()用法及代码示例
- Python Scipy stats.sem()用法及代码示例
- Python Scipy stats.halfnorm()用法及代码示例
- Python Scipy stats.fisk()用法及代码示例
- Python Scipy stats.beta()用法及代码示例
- Python Scipy stats.cosine()用法及代码示例
注:本文由纯净天空筛选整理自kshitijishere大神的英文原创作品 scipy stats.halfgennorm() | Python。非经特殊声明,原始代码版权归原作者所有,本译文未经允许或授权,请勿转载或复制。